EngageNY
Creating a Histogram
Display data over a larger interval. The fourth segment in a 22-part unit introduces histograms and plotting data within intervals to the class. Pupils create frequency tables with predefined intervals to build histograms. They describe...
EngageNY
Creating a Dot Plot
Which dot am I? Pupils create dot plots to represent sample data through the use of frequency tables. The third segment in a series of 22 asks individuals to analyze the dot plots they created. The scholars translate back and forth...
EngageNY
Displaying a Data Distribution
Pupils analyze a display of data and review dot plots to make general observations about the highest, lowest, common, and the center of the data. To finish, learners match dot plots to scenarios.
California Education Partners
Yum Yum Cereal
Design an efficient cereal box. Scholars use set volume criteria to design a cereal box by applying their knowledge of surface area to determine the cost to create the box. They then determine whether their designs will fit on shelves,...
California Education Partners
T Shirts
Which deal is best? Learners determine which of two companies has the best deal for a particular number of shirts. They begin by creating a table and equations containing each company's pricing structure. Individuals finish the seventh...
California Education Partners
Miguel's Milkshakes
Moooove over, there's a better deal over there! The fourth segment in a series of eight requires individuals to determine the best unit cost for milk. Scholars calculate the least amount they can spend on a particular quantity of milk....
California Education Partners
Least and Greatest
Squares can be magic. Pupils use their knowledge of addition of positive and negative rational numbers to create a 3 X 3 magic square where the sums are 1. Scholars create addition and multiplication expressions with a set of rational...
Mathematics Vision Project
Modeling Data
Is there a better way to display data to analyze it? Pupils represent data in a variety of ways using number lines, coordinate graphs, and tables. They determine that certain displays work with different types of data and use two-way...
Mathematics Vision Project
Connecting Algebra and Geometry
Connect algebra and geometry on the coordinate plane. The eighth unit in a nine-part integrated course has pupils develop the distance formula from the Pythagorean Theorem. Scholars prove geometric theorems using coordinates including...
Mathematics Vision Project
Systems of Equations and Inequalities
It's raining (systems of) cats and dogs! The fifth unit in a nine-part course presents systems of equations and inequalities within the context of pets. Scholars use systems of inequalities to represent constraints within situations and...
Mathematics Vision Project
Features of Functions
What are some basic features of functions? By looking at functions in graphs, tables, and equations, pupils compare them and find similarities and differences in general features. They use attributes such as intervals of...
Mathematics Vision Project
Linear and Exponential Functions
Provide a continuous progression to linear and exponential functions. Pupils continue to work with the discrete functions known as sequences to the broader linear and exponential functions. The second unit in a series of nine provides...
EngageNY
Problems in Mathematical Terms
Whether scholars understand independent and dependent variables depends on you. The 32nd installment of a 36-part series has learners analyze relationships in real-world problems through tables. They determine independent and dependent...
EngageNY
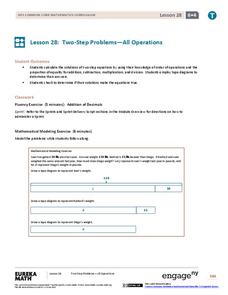
Two-Step Problems—All Operations
Step 1: Use the resource. Step 2: Watch your class become experts in solving two-step problems. Scholars learn to solve two-step word problems in context. They use tape diagrams and algebraic techniques to break the problem into two,...
Mathematics Vision Project
Congruence, Construction and Proof
Learn about constructing figures, proofs, and transformations. The seventh unit in a course of nine makes the connections between geometric constructions, congruence, and proofs. Scholars learn to construct special quadrilaterals,...
Mathematics Vision Project
Equations and Inequalities
Help learners get their facts in line to build and solve complicated linear equations and inequalities. Pupils build upon their knowledge of solving basic equations and inequalities to solve more complex ones. Individuals work with...
Mathematics Vision Project
Module 1: Sequences
Take steps into sequences. An 11-lesson unit builds upon pupils' previous understanding of writing expressions to develop the idea of sequences. The resource explores both arithmetic and geometric sequences using recursive and explicit...
EngageNY
Problem Solving and the Coordinate Plane
Class members investigate rectangles on the coordinate plane. They determine the length of line segments in the coordinate plane with the same x-coordinate or same y-coordinate and then solve geometric problems involving perimeter and...
EngageNY
Writing and Interpreting Inequality Statements Involving Rational Numbers
Statements often have multiple interpretations — but not these inequality statements. Scholars compare rational numbers and write inequality statements symbolically. The lesson includes problems that require comparing three numbers.
EngageNY
Divisibility Tests for 3 and 9
Who knew the sum of a number's digits gives such interesting information? The 18th installment of a 21-part module has scholars investigate division by three and nine. After looking at several examples, they develop divisibility tests...
EngageNY
Fraction Multiplication and the Products of Decimals
Class members come up with a hypothesis on the number of decimal digits in the product of two decimals. Learners work in groups to complete several decimal multiplication problems. The results help groups develop a conjecture on the...
EngageNY
Dividing Fractions and Mixed Numbers
Class members discover how to extend division to fractions to mixed numbers. Individuals first review how to convert mixed numbers to improper fractions and then apply division strategies learned in previous lessons. A memory game tests...
EngageNY
The Relationship Between Visual Fraction Models and Equations
Ours is to wonder why, not just to invert and multiply. The seventh installment of a 21-part module uses fraction models to help pupils understand why the invert-and-multiply strategy for dividing fractions works. They then work on some...
EngageNY
Creating Division Stories
Create your own adventure story ... well, not really. The fifth lesson in a 21-part series has pairs create story contexts for division problems. The lesson presents a step-by-step process for pupils to follow in writing such stories.


