EngageNY
Average Rate of Change
Learners consider the rate of filling a cone in the 23rd installment of this lesson series. They analyze the volume of the cone at various heights and discover the rate of filling is not constant. The lesson ends with a discussion of...
EngageNY
Truncated Cones
Learners examine objects and find their volumes using geometric formulas in the 21st installment of this 25-part module. Objects take the shape of truncated cones and pyramids, and individuals apply concepts of similar triangles to find...
Mathematics Common Core Toolbox
Golf Balls in Water
Here's a resource that models rising water levels with a linear function. The task contains three parts about the level of water in a cylinder in relationship to the number of golf balls placed in it. Class members analyze the data and...
Mathematics Assessment Project
Modeling Motion: Rolling Cups
Connect the size of a rolling cup to the size of circle it makes. Pupils view videos of cups of different sizes rolling in a circle. Using the videos and additional data, they attempt to determine a relationship between cup measurements...
Mathed Up!
Enlargements
Make enlargements with and without centers. Pupils work through seven problems dealing with dilations or enlargements. The first couple items are strict enlargements without centers, while the others have centers. Class members also...
Mathed Up!
Area of Compound Shapes
Scholars learn how to determine the area of compound shapes by finding the areas of the basic shapes that make it up. Pupils find the areas by adding areas together or subtracting them.
Mathed Up!
Angles in Polygons
Show your class that finding angle measures is a regular calculation with a resource that provides 12 problems dealing with the measures of angles in regular polygons. Pupils use formulas for the sum of measures of angles in a polygon to...
EngageNY
Comparing Irrational Numbers
Build on your classes' understanding of irrational numbers by comparing their values. The 13th lesson in the 25-part module has individuals estimate values of both perfect and non-perfect roots. They finish by graphing these numbers on a...
EngageNY
Solving Equations with Radicals
Show learners how to develop a procedure for solving equations using radicals with the fifth instructional activity of the 25-part module that challenges learners to use properties to solve multi-step quadratic and cubic equations....
EngageNY
Square Roots
Investigate the relationship between irrational roots and a number line with a resource that asks learners to put together a number line using radical intervals rather than integers. A great progression, they build on their understanding...
EngageNY
The Pythagorean Theorem
Class members explore the estimation of irrational numbers in association with the Pythagorean Theorem. The first lesson of this module challenges pupils to use the Pythagorean Theorem to find unknown side lengths. When the length is not...
American Statistical Association
An A-MAZE-ING Comparison
Teach your class how to use descriptive statistics through a hands-on data collection activity. Pupils collect their own data, calculate test statistics, and interpret the results in context. They compare male and female results, looking...
EngageNY
Informally Fitting a Line
Discover how trend lines can be useful in understanding relationships between variables with a lesson that covers how to informally fit a trend line to model a relationship given in a scatter plot. Scholars use the trend line to make...
EngageNY
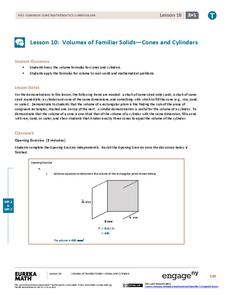
Volumes of Familiar Solids – Cones and Cylinders
Investigate the volume of cones and cylinders. Scholars develop formulas for the volume of cones and cylinders in the 10th lesson of the module. They then use their formulas to calculate volume.
Statistics Education Web
It Creeps. It Crawls. Watch Out For The Blob!
How do you find the area of an irregular shape? Class members calculate the area of an irregular shape by finding the area of a random sampling of the shape. Individuals then utilize a confidence interval to improve accuracy and use a...
Statistics Education Web
It’s Elemental! Sampling from the Periodic Table
How random is random? Demonstrate the different random sampling methods using a hands-on activity. Pupils use various sampling techniques to choose a random sample of elements from the periodic table. They use the different samples to...
Statistics Education Web
When 95% Accurate Isn’t
Investigate the effect of false positives on probability calculation with an activity that asks scholars to collect simulated data generated by a calculator. To finish, participants analyze the probability of certain outcomes which lead...
Statistics Education Web
Walk the Line
How confident are you? Explore the meaning of a confidence interval using class collected data. Learners analyze data and follow the steps to determine a 95 percent confidence interval. They then interpret the meaning of the confidence...
Statistics Education Web
Using Dice to Introduce Sampling Distributions
Investigate the meaning of a sample proportion using this hands-on activity. Scholars collect data and realize that the larger the sample size the more closely the data resembles a normal distribution. They compare the sample proportion...
Statistics Education Web
How High Can You Jump?
How high can your pupils jump? Learners design an experiment to answer this question. After collecting the data, they create box plots and scatter plots to analyze the data. To finish the instructional activity, they use the data to...
Statistics Education Web
What Does the Normal Distribution Sound Like?
Groups collect data describing the number of times a bag of microwave popcorn pops at given intervals. Participants discover that the data fits a normal curve and answer questions based on the distribution of this data.
Statistics Education Web
Sampling in Archaeology
Compare different random sampling types using an archaeological setting. Scholars collect data from an archaeological plot using simple random samples, stratified random samples, systematic random samples, and cluster random samples....
American Statistical Association
Colors Challenge!
Does writing the name of a color in a different colored ink affect one's ability to read it? Scholars design an experiment to answer this question. They collect the data, analyze the statistics, and draw a conclusion based on what they...
American Statistical Association
Chocolicious
To understand how biased data is misleading, learners analyze survey data and graphical representations. They use that information to design their own plans to collect information on consumer thoughts about Chocolicious cereal.


