EngageNY
The Mean as a Balance Point
It's a balancing act! Pupils balance pennies on a ruler to create a physical representation of a dot plot. The scholars then find the distances of the data points from the balance point, the mean.
EngageNY
Describing a Distribution Displayed in a Histogram
The shape of the histogram is also relative. Learners calculate relative frequencies from frequency tables and create relative frequency histograms. The scholars compare the histograms made from frequencies to those made from relative...
Noyce Foundation
Through the Grapevine
Teach statistics by analyzing raisins. A thorough activity provides lesson resources for five levels to include all grades. Younger pupils work on counting and estimation, mid-level learners build on their understanding of the measures...
Teach Engineering
Air Pollution in the Pacific Northwest
Scholars investigate levels of nitrogen dioxide in the Pacific Northwest by examining the role of nitrogen in air pollution and how remote sensing can be used to measure nitrogen levels. An Excel spreadsheet calculates the difference...
Curated OER
NFL Home Field Advantage?
Does the home team have the home field advantage in football? Class members look at a graph that displays wins at home and wins on the road for each NFL team from 2002–2012. Then they answer eight word problems that look at the...
Illinois Valley Community College
STEM Activities for Middle School Students
Use STEM activities within the class to provide connections to concepts. The resource includes activities that range from working with buoyancy to building rockets and launching them. Other activities involve the engineering design...
Noyce Foundation
Baseball Players
Baseball is all about statistics. Pupils solve problems related to mean, median, and range. They calculate the total weight of players given the mean weight, calculate the mean weight of reserve players given the mean weight of the...
Statistics Education Web
How Wet is the Earth?
Water, water, everywhere? Each pupil first uses an Internet program to select 50 random points on Earth to determine the proportion of its surface covered with water. The class then combines data to determine a more accurate estimate.
Teach Engineering
Off-Road Wheelchair Challenge
Challenge your class to use their understanding of the engineering design process to design and build a small-scale, off-road prototype for an assistive technology device. Teams select materials to build their scale models, and, using...
Curated OER
Candy Bars
There is often more to data than meets the eye. Scholars learn that they need to analyze data before making conclusions as they look at data that describes the number of candy bars boys and girls eat. They disprove a given conclusion and...
Teach Engineering
Super Slinger Engineering Challenge
How well can you launch a ping-pong ball? Small groups design launchers that can launch a ping-pong ball 20 feet into a target. The teams follow the engineering design process as they develop a solution that meets the design...
Math Worksheets Land
Zombie's Mean, Median, Mode, and Range
Given four sets of data, zombie-loving mathematicians find the mode, range, mean, and median for each set. The sheet is more challenging if calculators are not used; but the data set with large numbers may require a calculator.
Teach Engineering
Density Column Lab - Part 2
Groups suspend objects within layers of liquids to determine the densities of different liquids and compare them to the densities of objects calculated in Part 1. The groups then carefully test their calculations by layering the liquids...
Teach Engineering
Density Column Lab - Part 1
Mass and density — aren't they the same thing? This activity has groups use balance beams and water displacement to measure several objects. The pupils use the measurements to calculate the density of the objects.
Teach Engineering
The Magician's Catapult
Class members work in pairs to build a catapult to launch a grape a given distance. The catapult project, a compound machine, reinforces pupils' understanding of simple machines.
Teach Engineering
Trash to Treasure!
One person's trash is another man's treasure. Challenge your class to build something useful out of the trash they throw away on a regular basis. Groups design and build a practical item from trash they collect, allowing the class to...
Mathematics Assessment Project
Suzi's Company
Don't use an average resource ... use this one. As a middle school assessment task, learners first determine mean, median, and mode of salaries given in a frequency table. They then investigate how a change in one value changes the...
Teach Engineering
Global Climate Change
The greenhouse effect and its relationship to global warming is the focus of an activity that asks class member to consider the effects of climate change on weather. Pupils work with their families to determine their carbon footprints...
Teach Engineering
Earthquakes Living Lab: Locating Earthquakes
There are patterns in nearly everything — even earthquakes. Pairs research current earthquakes to see if there are any patterns. They determine the mean, median, and mode of the earthquake data, along with the maximum and minimum. Using...
Mathed Up!
Pictograms
Young mathematicians read, interpret, and complete a variety of real-world pictograms. Each question includes a key and information to complete the graphs.
Mathed Up!
Mean, Median, Mode, and Range
Learners read a variety of word problems and find the mode, median, range, and mode from a given set of data. If calculators are not desirable, provide the class with notebook paper to work out the equations.
Los Angeles County Office of Education
Assessment For The California Mathematics Standards Grade 6
Test your scholars' knowledge of a multitude of concepts with an assessment aligned to the California math standards. Using the exam, class members show what they know about the four operations, positive and negative numbers, statistics...
US Department of Agriculture
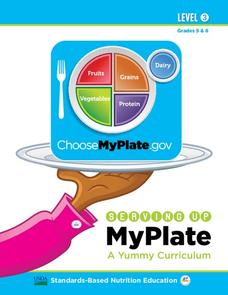
Serving Up My Plate
Within three nutrition-themed, inquiry-based learning opportunities, pupils take notice of their eating habits; delve deep into the five food groups, gain experience in planning meals, participate in a taste test, and explore ads from...
National Science Teacher Association
Middle School Sampler: Science
Focus on inquiry-based learning in your science class with a series of activities designed for middle schoolers. A helpful packet samples four different texts, which include activities about predator-prey relationships, Earth's axis and...


