National Council of Teachers of Mathematics
Nctm: Figure This: Who's on First Today?
Batter up! Who has the higher batting average, Joe McEwing or Mike Lieberthal? Try your computation and averaging skills in this real-world math challenge. Learn how sharpening your averaging skills can be valuable in real life...
ClassFlow
Class Flow: Statistics Landmarks Vote
[Free Registration/Login Required] This lesson uses clustering to explore the concept of mean, median, and mode of a set of data and calculates the arithmetic mean.
ClassFlow
Class Flow: Strategies to Meet Challenges
[Free Registration/Login Required] Challenge is another word for problem solving. In this flipchart students are given the four strategies for problem solving: Explore, plan, solve and reflect.
Free Math Help
Free Math Help: Median
Students learn how to find the median of a dataset. The tutorial consists of a definition and example.
Free Math Help
Free Math Help: Arithmetic Mean
Students learn how to find the arithmetic mean of data. The tutorial consists of a definition and examples with detailed solutions.
ClassFlow
Class Flow: Data Analysis
[Free Registration/Login Required] This flipchart shows two ways of asking survey questions; students compare the two ways. It can be used to learn how to do data analysis.
ClassFlow
Class Flow: Estimation
[Free Registration/Login Required] After this lesson, students will be able to solve problems using a variety of mental math strategies.
ClassFlow
Class Flow: Mode and Range
[Free Registration/Login Required] In this flipchart, students are introduced to two statistical concepts: mode and range.
Math Is Fun
Math Is Fun: How to Do a Survey
A clear explanation of how to plan and conduct a survey, then tabulate and display your results.
Teachnology
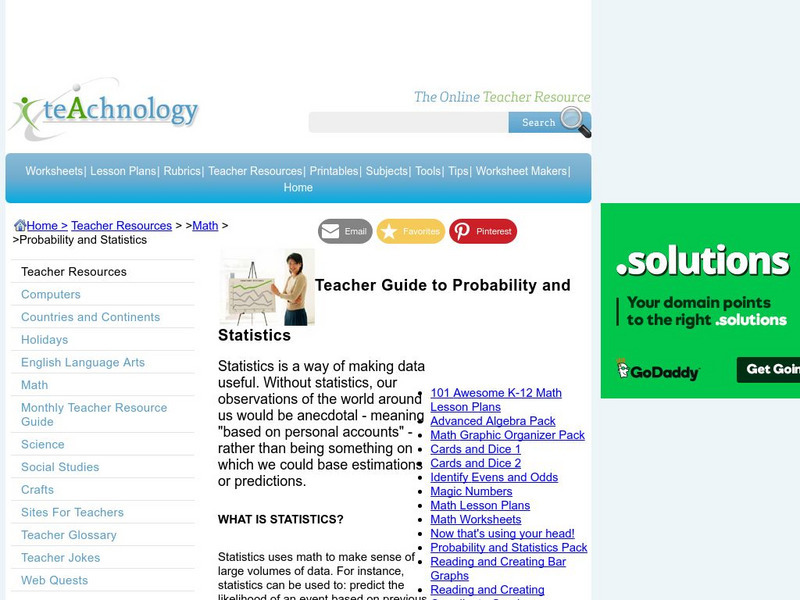
Teachnology: Teacher Guide to Probability and Statistics
Statistics Theme provides a collection of free sample worksheets, teacher resources, lesson plans and interactive media for grades k-12.
Math Slice
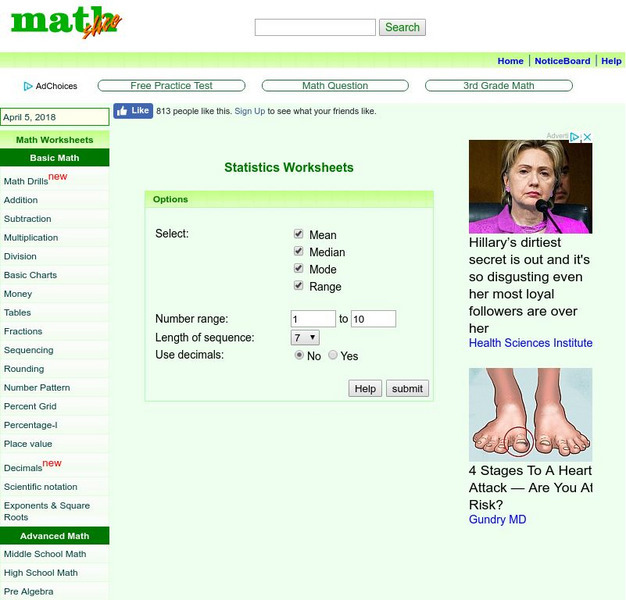
Math Slice: Statistics: Math Worksheets
This tool allows you to create worksheets where students calculate the mean, median, mode or range of a set of numbers.
University of Cambridge
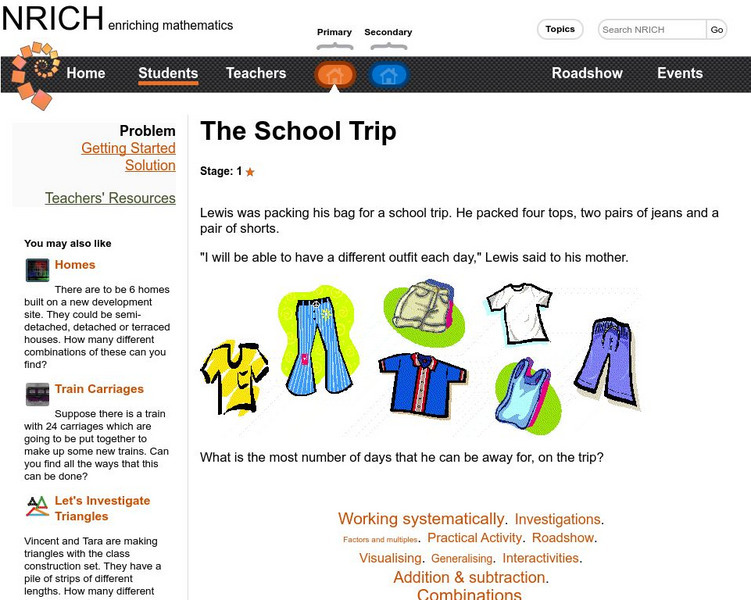
University of Cambridge: Nrich: Packing for the School Trip
Help Lorenzie figure out how many combinations he can make with the pants and shirts he is packing. Check the website for the solution.
University of Cambridge
University of Cambridge: Nrich: Good Work if You Can Get It
On this one page website sharpen your logic and problem solving skills while working on this challenge. The solution is available to double check your solution.
Shmoop University
Shmoop: Basic Statistics & Probability: Stem & Leaf Plots
Students learn about stem and leaf plots. Notes, examples, and practice exercises are included in the statistics resource.
That Quiz
That Quiz: Graficas
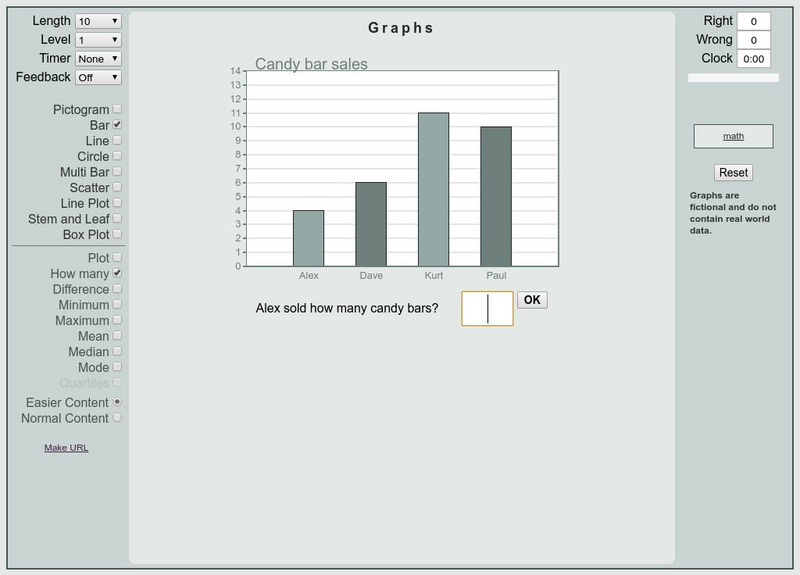
This is an interactive practice to review bar graphs, circle graph, scatter plot, etc. Test are timed and keep track of right and wrong answers. Different levels of difficulties are provided.
National Council of Teachers of Mathematics
Nctm: Figure This: How Many Fish in the Pond?
Can you figure out how many fish are in a pond? Use the statistical method of capture-recapture and estimation to solve this math challenge. An investigation from the NCTM Math Challenges for Families series. Discover how this skill can...
Rice University
What Percentage of Your Class Is Right or Left Handed?
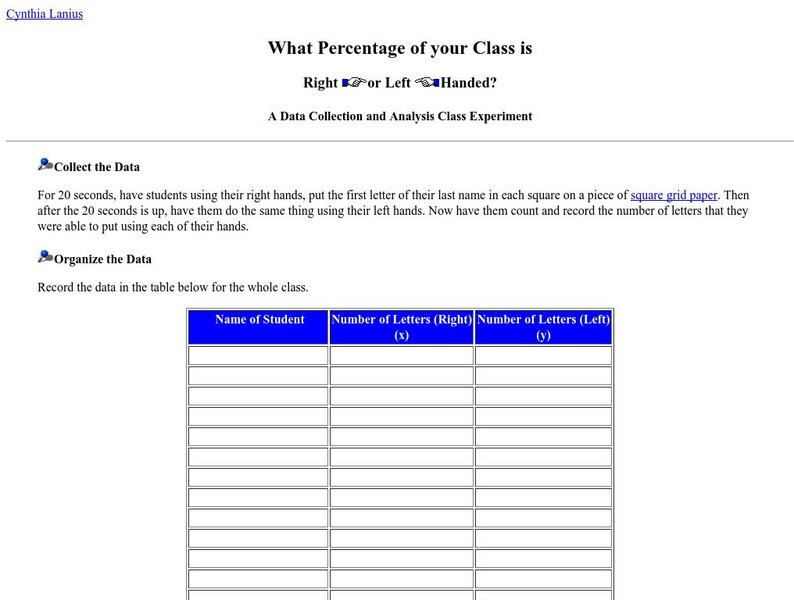
What percentage of the class is right or left-handed? Students will investigate this question using statistical processes of collecting the data, organizing it, graphing, and finally analyzing it. Follow-up questions are provided for the...
National Council of Teachers of Mathematics
Nctm: Figure This: Basketball Picks
A math challenge taken from the NBA that is sure to interest true basketball fans. Use your data collection, organization, and analysis skills to figure out which teams play each other. A one page NCTM Math Challenges for Families...
National Council of Teachers of Mathematics
Nctm: Figure This: Is There Room for All These Gifts?
This math challenge activity focuses on the concept of organizing information. Test your problem-solving aptitude as you try to figure out who received the most gifts.
AAA Math
Aaa Math: Statistical Mean
Learn about finding the statistical mean of a set of data, and then do some practice problems.
AAA Math
Aaa Math: Statistical Median Ii
Learn how to find the statistical median of a set of data, and then practice the skills.
AAA Math
Aaa Math: Statistical Range Ii
Learn how to find the range of a set of data, and then follow up with some practice problems.
Varsity Tutors
Varsity Tutors: Hotmath: Algebra Review: Range of Data
Find a quick, concise explanation of what a data range is. An example is given and clearly explained.


