Curated OER
Collect and Organize Data
In this data analysis learning exercise, 4th graders use a tally chart about favorite television programs. They record which are least or most popular, rankings, and combinations of programs.
Curated OER
Cereal Box Blocks and More!
Students sort and categorize different types of boxes and cartons. In this sorting lesson, students designate areas of the room to put different sizes, styles, or colors of boxes. They help their teacher count and graph the different...
Curated OER
Collect and Organize Data: Homework
For this collecting and organizing data worksheet, students use the tally chart for the students' eye color to answer the first two questions. Students then survey their family for eye color, record those results in a tally chart, and...
Curated OER
Collect and Organize Data: Reteach
In this data collection worksheet, students learn the parts of a tally chart and how it organizes information. Students then use the second tally chart to help them answer the six questions.
Curated OER
Mini Games
Students play a series of mini games in order to learn basic concepts in science and math. In this data collection lesson, students weigh rice, count time, participate in a marble grab, look at big feet, participate in a sponge squeeze,...
Curated OER
Favorite Sports Graph
In this data collection and graph worksheet, students ask each classmate which sport is their favorite based on the ones shown at the bottom of the graph. They color a square for each response, and tell the most and least popular sport.
Curated OER
Changing State
Students investigate the cooling and heating of water. In this online science experiment lesson, students work in groups to make predictions regarding freezing and boiling points and then test those predictions as they complete the...
Curated OER
Present Perfect Verb Tense- Class Data Collection Activity
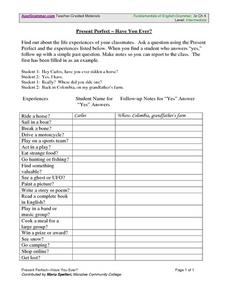
In this verb tense and data collection worksheet, students find out about the life experiences of their classmates. They ask questions using the present perfect tense and the suggestions in a chart on the page. They record the...
Curated OER
Recording Data From a Survey Reteaching Worksheet
In this recording data from a surveys reteaching worksheet, 2nd graders review the use of tallies when recording data. They use the information to make a data table and a bar graph that displays the information.
Curated OER
Skating Data
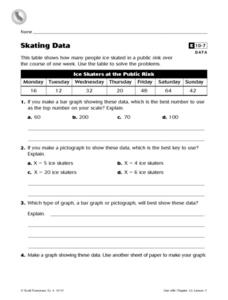
In this collecting data worksheet, 4th graders view a table on ice skaters at a public rink in order to answer 2 multiple choice questions, 1 short answer question and make a graph showing one piece of the data.
Curated OER
Collecting Data
In this data collection worksheet, students read about how data is collected and organized. They also learn about a hypothesis. Students read through examples of different charts and then answer 23 questions pertaining to data...
Curated OER
Bean Growth Project Graph Worksheet
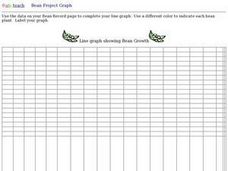
In this bean growth project graphing worksheet, student collect data and create a line graph. They use a different color for each line that shows the growth of each bean plant.
Curated OER
Mean, Median, and Mode 1
For this mean, median and mode worksheet, students use the measures of central tendency to describe given statistical data. Students identify the range of data, and match data to its representative bar graph. Two multi-step problems...
Curated OER
Bar Graphs
In this bar graphs worksheet, students, working with a partner, explore how to read and analyze the five answers to one mathematical bar graph.
Curated OER
Collecting And Organizing Data
In this collecting and organizing data worksheet, students, with a partner, problem solve and calculate the answers to six mathematical word problems.
Curated OER
Family TV
In this family TV worksheet, students study, examine and make predictions about several television shows, collect data and then chart their data collected.
Curated OER
Colors Samples
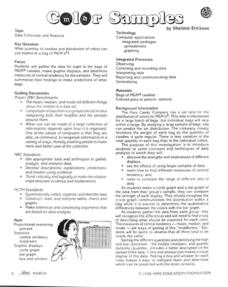
In this math worksheet, students take the time to count out the colors of the candies. They graph the results and make inferences from the information.
Curated OER
Weather Station Report
In this science worksheet, middle schoolers fill out the data report for the seven different questions. The focus is upon the interpretation of data.
Curated OER
Weather Instrument Data Chart
In this science worksheet, students look for the answers to the correct place on the data chart. They organize and make interpretations of the data.
Curated OER
Weather Instrument Data Information
In this science worksheet, students are given the task of recording weather information twice daily using the homemade weather instruments.
Curated OER
Favorite Candy Bar Graph
Students decide on six different types of candy bars to include in a data collection activity. Working in small groups, they survey a target group in a set amount of time. They access a Internet based graphing tool to create a bar graph...
Curated OER
M & Ms in a Bag
Students make predictions about the number and colors of M&M's in a snack size package. They create an Excel spreadsheet to record the data from their small group's bag, create a graph of the data, and discuss the variations of data...
Curated OER
Bouncing Ball Experiment
Students collect data for a bouncing ball and select one bounce to analyze. They explore the relationship between velocity, position and acceleration. They seek out connections between the graphs and the physical motion of the ball.
Curated OER
Data Collection
Students explore the reason for collecting and analyzing facts and figures or data and statistics. They show how data can be used to help us to solve real life problems and plan for the future. Students use everyday problems that can be...


