Curated OER
Geometric Figures
Students compare, classify and calculate the area of geometric figures such as rectangles, squares, circles and triangles.
Curated OER
Collecting Data and Graphing
Eighth graders, in groups, count the different colors of M&M's in each kind of package and then draw a pictograph to show the results. Each group writes a program to show their results and then compare the manually-drawn and computer...
Curated OER
Chart the Weather for Cities Around the World
Students orally describe Northern and Southern hemispheres, identify 7 continents, and point out specific countries and cities. They locate and record weather information.
Curated OER
Ketchup to Collecting Data
First graders collect data for a survey of 3 brands of ketchup and create class charts. They taste test three different brands of ketchup, and use the data to create a presentation. Tasty lesson!
Curated OER
Parts Are Parts: The English Measurement System
Third graders view and measure common body parts to find a fathom, a span, and inch. They discuss the historical information about how standard English measurements came to be and why body parts can no longer be used as a standard...
Curated OER
Predicting Monthly Precipitation
Students should log onto, and collect data from, a specific site on the Internet. They average and compare the data using the Excel spreadsheet program, make predictions from their data, and determine the percent error of their predictions.
Curated OER
Follow Spring's Journey North Recording Highlights of the Season
Students scan headlines on the Journey North News Updates each day to track the changes that spring brings as it comes to different areas of the United States.
Curated OER
Do You Like to Spend or Save?
Students, after briefly discussing spending and saving habits, take a poll to see how their peers like to manage money. Then students graph their findings and discuss the survey results.
Curated OER
Walking the Plank
Eighth graders experiment with a bathroom scale, books and a plank to determine how weight readings change as distance is applied. They graph and interpret the results.
Curated OER
Raisin Cane
Learners estimate and record the number of raisins in a snack-size box. They also graph their results and note the differences (+ or -) from their estimate and actual number.
Curated OER
Viewing Tubes
Middle schoolers complete a lab in order to discover if the length of a viewing tube, its diameter, or the distance from an object affect the type of data collected and the resulting graph.
Curated OER
Bubbles
Third graders perform an experiment using different mixtures of dishwasher detergent. They construct bar graphs that record their bubble data for each detergent set.
Cyberbee
Cyberbee: Who Dunnit?
If you are a crime scene investigation (CSI) fan, then you will love this site! You get to be the detective by examining the evidence, viewing the crime scene, dusting for fingerprints, interviewing the suspects, and solving the crime.
University of South Florida
Fcat: Drops on a Penny: Teacher Notes
Young scholars learn how to create stem-and-leaf diagrams and boxplots by collecting data on the surface tension of water molecules. This hands-on activity using pennies is a great way to learn how to organize data.
University of South Florida
Florida Center for Instructional Tech: Walking the Plank
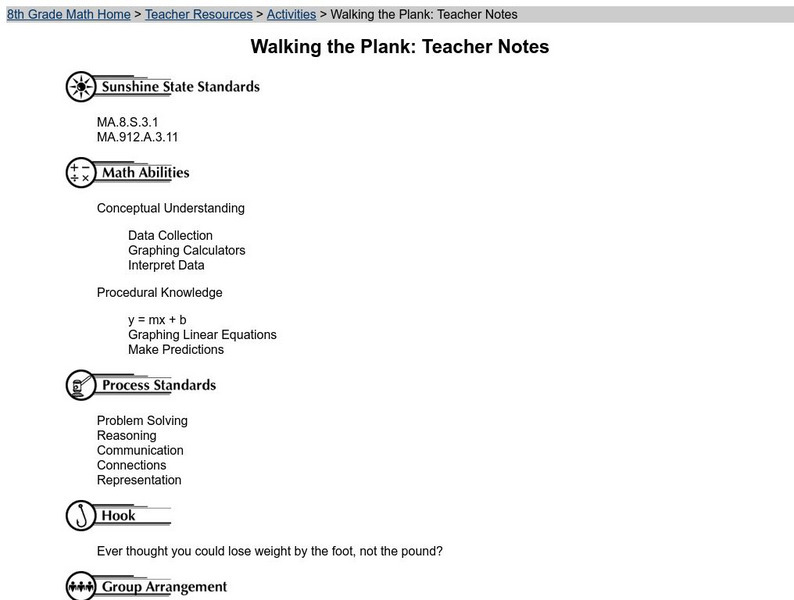
Young scholars use weight to collect data and investigate the linear relationship. This activity uses a graphing calculator.
Science Museum of Minnesota
Thinking Fountain: Life Cycle of a Fruit Fly
With a 2-liter bottle and some fruit, you can construct a fruit fly trap, which will allow you to observe the life cycle of a fruit fly.
Hunkins Experiments
Hunkin's Experiments
This amazing website provides access to 200 exciting experiments from cartoonist, broadcaster, and engineer, Tim Hunkin. Each experiment is categorized and illustrated.
US Department of Education
Helping Your Child Learn Math: Math at the Grocery Store
Make grocery shopping a mathematical experience. Parents and children explore a variety of math concepts through this collection of engaging math activities. Lesson are presented in varying levels of difficulty, offer "Parent Pointers"...
US Department of Education
Helping Your Child Learn Math: Math in the Home
An excellent compilation of activities that engage parents and children in math explorations at home. Detailed lessons covering a wide range of math topics such as fractions, measurements, money, data collection, and math in newspapers....
Science Buddies
Science Buddies: An Experiment in Visual Perception
Graphical methods of data presentation are a key feature of scientific communication. This project will get you thinking about how to find the best way to communicate scientific information.
Science Buddies
Science Buddies: Interpreting Area Data From Maps vs. Graphs
Graphical methods of data presentation are a key feature of scientific communication. This project asks the question, "What's the best way to compare the land area of states: a map or a bar graph?" You'll be measuring performance on two...
Vision Learning
Visionlearning: Data: Data Analysis and Interpretation
An explanation of data from collection to analysis. Includes a discussion of how the same data may be interpreted various ways by different individuals.
Vision Learning
Visionlearning: Data: Uncertainty, Error, and Confidence
An explanation of how errors may affect data that has been collected for experimentation. Some examples are given.
Vision Learning
Visionlearning: Data: Using Graphs and Visual Data in Science
An explanation of how data can be turned into visual forms which can help people comprehend information easier than observing numbers.


