NOAA
Tracking a Drifter
Be shore to use this drifter resource. The third installment of a five-part series has learners using the NOAA's Adopt-a-Drifter website to track to movement of a drifter (buoy) in the ocean. Graphing the collected data on a map allows...
Rochester Institue of Technology
Ergonomic Packing
Pupils revisit the concepts of ergonomics and order picking examined in previous lesson plan and use the results of a simulation to brainstorm ergonomic designs for medical supply stations.
NOAA
Ground-truthing Satellite Imagery with Drifting Buoy Data
Ground-truthing ... is it even a word? The last installment of a five-part series analyzes how scientists collect sea surface temperature data. Scholars use government websites to compare temperature data collected directly from buoys...
NOAA
Graphing Temperatures
Battle of the hemispheres? In the fourth installment of a five-part series, young oceanographers use the NOAA website to collect temperature data from drifters (buoys), one in the Northern Hemisphere and one in the Southern Hemisphere....
Statistics Education Web
Population Parameter with M-and-M's
Manufacturers' claims may or may not be accurate, so proceed with caution. Here pupils use statistics to investigate the M&M's company's claim about the percentage of each color of candy in their packaging. Through the activity,...
Statistics Education Web
The Case of the Careless Zookeeper
Herbivores and carnivores just don't get along. Using a box of animal crackers, classes collect data about the injury status of herbivores and carnivores in the box. They complete the process of chi-square testing on the data from...
Statistics Education Web
First Day Statistics Activity—Grouping Qualitative Data
Making groups of groups can help to organize data. Classes use statistics to group themselves using descriptive adjectives. The objective is for learners to understand that grouping qualitative data is useful when the original groups are...
Statistics Education Web
10,000 Steps?
Conduct an experiment to determine the accuracy of pedometers versus pedometer apps. Class members collect data from each device, analyze the data using a hypothesis test, and determine if there is a significant difference between the...
Teach Engineering
Combustion and Air Quality: Emissions Monitoring
Help your class determine the types of pollutants coming from vehicle exhaust. Groups use an air quality monitor to determine the emissions from different vehicles, to gain knowledge about combustion energy, and to predict how the...
Teach Engineering
Android Acceleration
Prepare to accelerate your Android. Pupils prep for the upcoming activity in this third installment of a four-part series. The lesson progresses nicely by first introducing different types of acceleration to the class. The teacher...
Teach Engineering
Storing Android Accelerometer Data: App Design
There's an app for that! Pupils learn to build an app that will store data on an Android. The instructional activity introduces class members to the tiny database, TinyDB, for Android devices. A video tutorial provides an example that...
Michigan State University
In Search of Life
Explore the habitats around you with an activity that takes kids out of the classroom to learn about the local variety of habitats and the living things that call them home. In small groups, scholars investigate their surroundings,...
Code.org
Discover a Data Story
"Data is so boring, there's no way to find any patterns in them." Or is there? Pairs investigate data sets using different data visualization tools to discover a trend that may exist in a data set. Once they find a trend or pattern,...
Code.org
Introduction to Data
Data, data everywhere. Challenge your class to begin thinking about data, the ways people collect information, and what we can learn from this data. Class members discuss sources of data and then individuals answer questions in the class...
Code.org
Cleaning Data
"Clean the data!" "I did not know it was dirty." Introduce your class to the process of cleaning data so that it can analyze it. Groups work through a guide that demonstrates the common ways to filter and sort data. Pairs then...
Code.org
Practice PT - Tell a Data Story
Show your class how it all comes together. The last lesson in a unit of 15 has individuals take everything they learned in the data section to analyze the class-generated data. The pupils find a story they want to tell that appeals to...
Teach Engineering
Sliders (for High School)
Slip sliding away. Groups investigates the two types of friction by running an experiment that allows them to calculate the coefficient of static friction and the coefficient of kinetic friction. The experiment uses a box, a basket, and...
Mr. E. Science
The Scientific Method
The scientific method is key to implementing tests and experiments. From stating the problem to arriving at the conclusion, every scientist in the class learns the value of the method through an educational slide show presentation.
National Science Teacher Association
Middle School Sampler: Science
Focus on inquiry-based learning in your science class with a series of activities designed for middle schoolers. A helpful packet samples four different texts, which include activities about predator-prey relationships, Earth's axis and...
Curated OER
Water Down the Drain
Did you know that leaky faucets waste $10 million worth of water? Conservationists perform an experiment and draw best-fit lines to explore how the US Geological Society determined this value.
West Contra Costa Unified School District
Scientific Method Mania
Horrible science puns only happen periodically, but the scientific method is forever. Young scientists observe two presentations on the scientific method, complete independent practice worksheets, and integrate their knowledge through a...
Fort Bend Independent School District
Data Analysis - AP Statistics
What better way to study survey design than to design your own survey! Bring a versatile data analysis project to your AP Statistics class, and encourage them to apply the practices from their instructions to a real-world survey project.
Houston Area Calculus Teachers
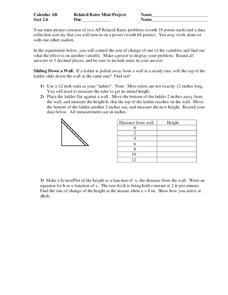
Related Rates
Use a hands-on approach to exploring the concepts of related rates in your AP Calculus class. Individuals explore the effect of the rate of change on a variable related to a variable they control. After analyzing the data they collect,...
National Security Agency
Starting a Restaurant
Through an engaging unit, chefs-in-training will sort and classify data using tally charts. Learners will also create bar graphs to display restaurant data and interpret data from bar graphs using a variety of categories. This is a fun...


