Curated OER
Graphs
In this bar graph worksheet, 6th graders complete word problems based on a bar graph of number of cans of food collected. Students complete 8 problems.
Curated OER
Graphs
In this graphs learning exercise, students complete word problems about a bar graph of tickets sold for the drama club. Students complete 8 problems.
Curated OER
Bar Graphs
In this bar graph instructional activity, students complete word problems about a bar graph containing the results of student's rock collections. Students complete 8 problems.
Curated OER
Data and Graphs
In this data and graphs activity, students complete multiple choice questions about which bar graphs represent the data given and complete a bar graph based on data given. Students complete 3 problems.
Curated OER
Graphs
In this bar graph worksheet, students answer questions for a bar graph that is about students taking part in a math class. Students complete 6 problems total.
Curated OER
Introduction to Dr. Seuss
First graders look at slides on the SMART Board of different facts about Dr. Seuss and then create a class bar graph of their favorite Dr. Seuss books. In this Dr. Seuss lesson plan, 1st graders review and list facts that they learned...
Curated OER
Groundhog Day
Learners use the SMART Board to learn about Groundhog day and create a tally chart of predictions for whether he will see his shadow or not. In this Groundhog day lesson plan, students respond to questions throughout the instructional...
Curated OER
Collecting Data
In this algebra worksheet, students collect and analyze data. They graph and identify their solutions. There is one question with an answer key.
Curated OER
Integrated Algebra Practice: Histograms
In this histogram learning exercise, students solve 6 multiple choice and short answer problems. Students read histograms and determine the frequency of a particular item.
Curated OER
How to Make Histograms
Students collect data and plot it using a histogram. In this statistics lesson, students interpret histograms. They find the frequency, percents and density.
Curated OER
Integrated Algebra Practice: Box and Whisker Plots
In this box and whisker plot worksheet, students solve 5 short answer problems. Students use box and whisker plots to describe data and determine what percentile a piece of data belongs.
Curated OER
Graphing Fun In Third Grade
Third graders display information in a graph, table, and chart. In this data lesson plan, 3rd graders look at graphs, tables, and charts, discuss their importance, and make their own.
Curated OER
Easter Candy Count
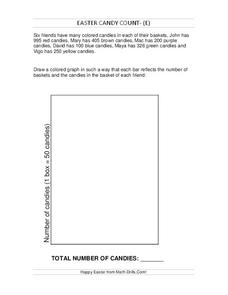
In this bar graph worksheet, students fill in the bar graph based on the information about Easter candy that each child got. Students complete 6 spaces in the bar graph and find the total number of candies.
Curated OER
Easter Candy Count
For this bar graph worksheet, students complete a bar graph based on the information of Easter candy they are given for each color. Students complete 6 spaces in the bar graph and find the total.
Curated OER
Easter Candy Count
In this bar graph worksheet, students fill in the bar graph with the information of Easter candy that each child has and find the total. Students fill in 6 bars in the bar graph.
Curated OER
Easter Pictograph
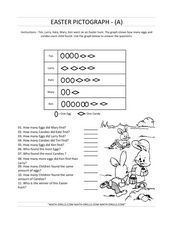
In this pictograph instructional activity, students look at the Easter pictograph and solve problems based on the graph. Students complete 10 problems.
Curated OER
Easter Bar Graph- A
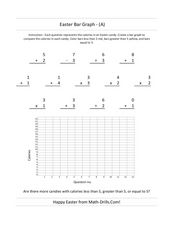
In this Easter math activity, students first solve 13 problems with addition, subtraction, multiplication and division. Using the answers, students make a bar graph.
Curated OER
Easter Bar Graph - C
In this math review learning exercise, students complete addition, multiplication, division, and subtraction problems where each answer is inserted into a bar graph. Students complete 13 problems.
Curated OER
Easter Bar Graph - (E)
In this math review worksheet, students complete addition, multiplication, division, and subtraction problems where each answer is put into an Easter bar graph. Students complete 13 problems.
Curated OER
Easter Bar Graph - (B)
In this math review worksheet, students complete addition, subtraction, multiplication, and division problems and put their answers into a bar graph that represents calories. Students complete 13 problems and 1 graph.
Curated OER
Easter Bar Graph - (D)
In this math review worksheet, students complete addition, multiplication, division, and subtraction problems where each answer is put into an Easter bar graph. Students complete 13 problems.
Curated OER
Easter Candy Count
In this bar graph worksheet, students complete a bar graph based on the information of Easter candy they are given for each color. Students complete 6 spaces in the bar graph and find the total.
Curated OER
Easter Candy Count
In this bar graph worksheet, students complete a bar graph based on the information of Easter candy they are given for each color. Students complete 6 spaces in the bar graph and find the total.
Curated OER
Bar Graphs and Data Analysis
In this graphing worksheet, students look at a bar graph of allowance and dollars. They answer 6 questions related to the bar graph.


