Curated OER
Graphing Our Favorites
Second graders use a computer program to follow directions and graph their favorite things into a bar graph. In this graphing lesson plan, 2nd graders have 30 choices of favorite things to graph.
Curated OER
Student Heights
Students measure the heights of their fellow classmates and create a box and whisker plot to display the data. In this measurement lesson plan, students analyze the data and record results.
Curated OER
Graph Those Stickers!
Students graph fruit. In this graphing lesson students create a graph using fruit label stickers. Students place a sticker on the graph when the fruit has been consumed.
Curated OER
Creating Circle Graphs with Microsoft Excel
Students create graphs of circles. In this geometry lesson, students use Microsoft Excel to create graphs. They construct the graphs using paper and pencil as well as the computer.
Curated OER
Statistical Calculations Using M&Ms
In this frequency worksheet, students investigate, frequency, box plots, and percentage using a package of M&Ms. Copies of the actual correspondences with the Mars company are also included.
Curated OER
The Circle Graph
In this circle graph worksheet, students complete problems involving many circle graphs including a compass rose, degrees, and more. Students complete 7 activities.
Curated OER
Understanding Statistics
In this statistics worksheet, students examine and interpret pictographs and line graphs. Students analyze the provided data in order to create bar graphs, circle graphs, and box and whisker plots. The nine page worksheet accompanies a...
Curated OER
Olympic Line Graphs
Sixth graders examine how to make line graphs. In this Olympic line graph lesson students make line graphs and search the given Internet sites to find data on their summer Olympic Game.
Curated OER
Grid Sheet
In this grid worksheet, students use these grids to draw graphs of problems they solve. Students have 2 grids to use on this worksheet.
Curated OER
Colours of the Church Year
For this Colours of the Church Year worksheet, students use the chart 'Colours of the Church Year' to complete the pie-chart with the Church seasons and fill in the missing words.
Curated OER
Reading and Interpreting Graphs Worksheet
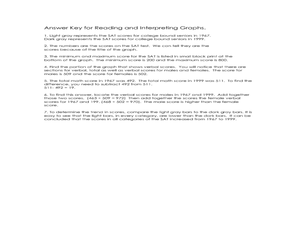
In this bar graphs instructional activity, students read and interpret a bar graph on SAT scores by answering short answer questions. Students complete 7 questions total.
Curated OER
Graphing With Paper and Computers
Fourth graders construct bar graphs. In this graphing lesson, 4th graders create bar graphs in connection with the story, The Copycat Fish. After creating the initial graphs on paper, students use MS Excel to create graphs.
Curated OER
Magnets and Interactions
Second graders discover what magnets can do. In this magnet instructional activity students make predictions about magnets. They experiment with the magnets and record their data on a chart.
Curated OER
Dialogue Tags/ Synonyms for Said
Sixth graders analyze dialogue tags. In this synonyms lesson students work in groups analyzing a personal narrative. They enter the words onto a classroom chart as well as their notes or journal. The students replace tags with more...
Curated OER
Fourteen Math Regent Exam Statistics Questions on Scatter Plots and Linear Regression
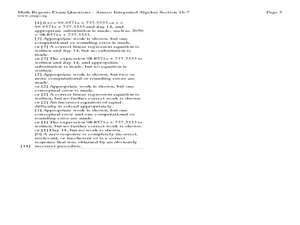
For this linear regression worksheet, students solve fourteen Math Regent Exam questions regarding scatter plots and linear regression. The solutions are provided.
Curated OER
Earthquake on the Playground
Learners investigate earthquakes by examining chart data. In this disasters instructional activity, students identify the waves that are recorded when an earthquake arises by reading sample graphs in class. Learners participate in an...
Curated OER
Make a Line Graph
In this make a line graph learning exercise, 6th graders make a line graph for 2 sets of data, using a blank grid, by plotting the numbers, labeling the x and y axes and writing a title.
Curated OER
Learning to Read Graphs
In this learning to read graphs worksheet, students look at the graph showing children's favorite colors, then write how many children like each of the 4 colors.
Curated OER
Graphing Worksheet: Favorite Sports
In this graphing worksheet, students analyze a bar graph in which favorite sports are displayed. Students answer 8 questions about the graph. Note: The bars in the graph are shaded in different colors.
Curated OER
Census Statistics and Graphing
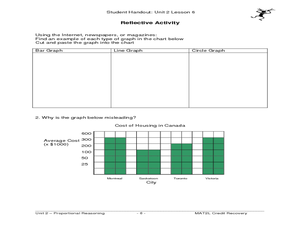
Students graphically represent data from the Census. In this middle school mathematics lesson, students investigate the housing characteristics of different tribes of Native Americans and compare them to the average American...
Curated OER
Graphs
Learners investigate circle and bar graphs. In this middle school mathematics lesson, students determine which kind of graph is suitable for a given situation and create circle and bar graphs.
Curated OER
Line Graphs and Commercial Costs
Students investigate line graphs. For this middle school mathematics lesson, students compare and contrast different types of graphs and create line graphs based on the data provided.
Curated OER
Scatterplots
In this statistics worksheet, students create a scatter plot based on their analysis of data provided form the space shuttle Challenger disaster. The five page worksheet contains four questions. Answers are not provided.
Curated OER
Measures of Central Tendencies: Quartiles
In this statistics worksheet, students calculate the mean, median, mode, range, lower quartile, and upper quartile for 10 questions and interpret a box and whiskers graph.


