Curated OER
Count the Tally Marks
In this counting skills worksheet, students examine 6 set of tally marks, count each of the sets, and record the number in each of the sets.
Curated OER
Count and Tally
In this counting skills worksheet, students respond to 4 questions that require them to count items pictured and use tally marks to total them.
Curated OER
Count and Tally 2
In this counting skills worksheet, learners respond to 6 questions that require them to count items pictured and use tally marks to total them.
Curated OER
Lucky Charms Sort
Students make a bar graph. In this sorting and counting lesson, students use the Lucky Charms cereal to sort the marshmallows into separte cups, count how many marshmallows are in each cup and make a bar graph to compare the numbers.
Curated OER
Bluebird Eggs in Nestbox chart
For this bluebird eggs worksheet, students fill out the chart which resembles a bar graph on how many eggs each bluebird has and answer short answer questions. Students answer 5 questions.
Curated OER
Think Science - Collecting Data
In this data collection worksheet, students collect data about butterflies and milkweed plants and record the measurement tools they use to collect it. Students complete 2 columns.
Curated OER
Organising Data
Students complete data organization activities. In this data organization lesson, students watch online clips about organizing data. Students complete an eye color frequency table for their class. Students watch a clip about asking...
Curated OER
What Days Are the Busiest in the Maternity Ward?
Students form a conclusion using statistical data. In this statistical data lesson plan, students collect and analysis data to form a conclusion about what day of the week most babies are born.
Curated OER
Data Handling
In this data handling instructional activity, learners explore multiple ways to represent data. They create stem and leaf plots, histograms, and bar charts. Students examine and interpret diagrams and statistics. This eleven-page...
Curated OER
Comparing Themes and Plots
Students compare theme and plot in two short stories by Nathaniel Hawthorne. In this theme and plot analysis instructional activity, students read Young Goodman Brown and The Minister's Black Veil as well as take notes about the theme...
Curated OER
Chart problems involving car defects and customer service departments
In this interactive worksheet, students solve two problems using the charts provided. Students must convey they are able to understand charts and how to read them.
Curated OER
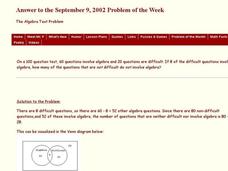
The Algebra Test Problem
In this algebra test worksheet, students construct and interpret a Venn Diagram. They determine the type of algebra problems designated in the Venn Diagram. This one-page worksheet contains 1 problem. The answer is provided at the...
Curated OER
Frequency Histograms, Bar Graphs and Tables #3
In this frequency histograms worksheet, students examine bar graphs, histograms and tables. They identify the model of information that best matches the statistics. This three-page worksheet cotnains two multiple-choice problems. ...
Curated OER
My Science Box
Students investigate snails and their physical and behavioral characteristics. In this investigative lesson students create a pie chart to show the results of their findings.
Curated OER
Using a Statistical Procedure To Search A Database For Out of the Ordinary Values
Young scholars develop a spreadsheet containing formulas and find summaries for them. In this investigative lesson students choose a topic, investigate it and use MS Excel to sort data.
Curated OER
Introduction to Graphs: Bar Graphs, Line Graphs, Circle Graphs
In this graphing data worksheet, students answer 5 short answer questions about graphs. Students determine which type of graph best represents various data sets.
Curated OER
Data Analysis
In this data analysis worksheet, pupils solve and complete 4 different types of problems. First, they reduce the data provided to find the means, and graph the means in a line graph. Then, students graph the data from each mixture shown...
Curated OER
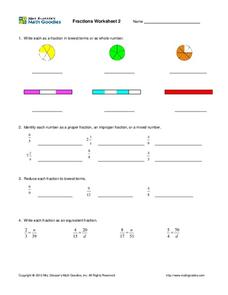
Fractions: pie graphs, numbers, and bars
In this fraction worksheet, middle schoolers complete fraction problems containing pie graphs, numbers, bars, proper fractions, lowest terms, and more. Students complete 19 problems.
Curated OER
Race the Track! Jump the Gap
Students record data of using a track system with variables and how those variables affect a ball used in the track. In this track lesson plan, students design their own track in groups, test the ball's rates of speed, and record their...
Curated OER
Six Squares
Students create different shapes on grid paper. In this two-dimensional geometry lesson, students take turns outlining a shape made of six squares on the graph paper. They identify all shapes they see once everyone has had a turn.
Curated OER
Country Locations
First graders read a story and locate where the countries in the story are located. In this traditions lesson, 1st graders explore food dishes from different countries and discuss where they are located. Students tell their favorite...
Curated OER
Cause and Effect
Third graders investigate cause and effect. In this cause and effect lesson, 3rd graders read a story and determine what are the causes and effects. Students match sentence strips to the make the correct cause and effect sentence....
Curated OER
Graphing
Fifth graders practice using math graphs. In this graphing instructional activity, 5th graders work in groups to develop a topic of their own to represent as a graph. Students collect data and construct a graph for the instructional...
Curated OER
Table Readings
In this table worksheet, students read questions and interpret tables. Questions include information concerning unemployment, oil imports, and foreign students. This multiple-choice worksheet contains 10 problems. Answers are provided.


