Texas Instruments
Texas Instruments: Simulation of Sampling Distributions
This set contains questions about simulating sampling distributions. Students see graphs of simulated distributions enabling them to reach conclusions about mean, shape, and standard deviation.
Texas Instruments
Texas Instruments: Data and Statistical Methods 1
In this set of exercises, a set of data is provided; students answer questions about mean, median, mode, and quartiles. Questions are multiple choice with solutions provided.
Texas Instruments
Texas Instruments: Probability as Relative Frequency
In this activity, students use simulation to justify the concept of the Law of Large Numbers. They understand that as the sample size increases, the relative frequency of which an event occurs approaches the probability of that event...
Texas Instruments
Texas Instruments: What Is Your Grade (Part 2)
In this activity, students use the CellSheet Application to determine the missing value in a weighted mean. They use the application to write a formula to find the weighted mean and also learn to use the copy and paste features.
Science Education Resource Center at Carleton College
Serc: Nitrate Levels in the Rock Creek Park Watershed: Meas of Central Tendency
Activity uses water-quality data from Rock Creek Park to illustrate elementary statistical measures of exploratory data analysis. The focus of the lesson is the nutrient limitation in a stream and the three measures of central tendency.
Stefan Warner and Steven R. Costenoble
Finite Mathematics & Applied Calculus: Measures of Central Tendency
Students learn about measures of central tendency. Topics explored are mean, median, mode, and expected value. The tutorial investigates the statistics concepts through class notes and examples. Review exercises and a chapter quiz are...
Stefan Warner and Steven R. Costenoble
Finite Mathematics & Applied Calculus: Mean, Median & Standard Deviation
Students learn about mean, median, variance, and standard deviation. The tutorial investigates the statistics concepts though class notes and examples. Review exercises are included.
Rice University
Hyper Stat Online Statistics Textbook: Central Tendency
Click on mean, median, mode, trimean, or trimmed mean to review central tendency.
Beacon Learning Center
Beacon Learning Center: All That Data 2
Students describe graphs and explore range, measures of central tendency, and distribution in this interactive web lesson.
Beacon Learning Center
Beacon Learning Center: All That Data
Students analyze data by finding the mean, median, mode, and range of a set of numbers. Line plots, bar graphs, and circle graphs are also included in this lesson.
Oswego City School District
Regents Exam Prep Center: Statistical Studies, Central Tendency, and Dispersion
The mathematics tutorial investigates statistical studies, central tendency, and dispersion. The lesson consists of class notes, calculator tips, examples, and practice problems with solutions. The teacher resource includes an activity...
PBS
Pbs Mathline: Bubble Mania [Pdf]
Bubble Mania is a lesson plan that focuses on the concept of measurement as it applies to the diameter, circumference, and area in a bubble. Extension activities and connections, related worksheets, and additional resources are included.
Other
Stat Soft: Statistics Glossary
Dozens of statistical terms are defined and illustrated in this glossary.
Other
Sprk: Macro Lab Lesson 3 Mean, Median, & Mode: Teacher Guide [Pdf]
Students will use Sphero to conduct an experiment. They will identify how long they need Sphero to move at 10% speed to reach and knock over a target object (such as a whiteboard marker). Using this information, they will then calculate...
TOPS Learning Systems
Top Science: Tack Toss [Pdf]
An activity where students toss a set of tacks one hundred times and plot how many land on their sides each time. They then calculate the mode, median, and mean.
McGraw Hill
Glencoe Mathematics: Quiz on Measures of Central Tendency
Students examine advanced mathematics concepts with this online quiz. The assessment shows comprehension of measures of central tendency. Topics include mean, mode, and median.
Sophia Learning
Sophia: Finding Mean, Median, and Mode: Lesson 1
This lesson will demonstrate how to find the mean, median, and mode for a set of data. It is 1 of 5 in the series titled "Finding Mean, Median, and Mode."
Mangahigh
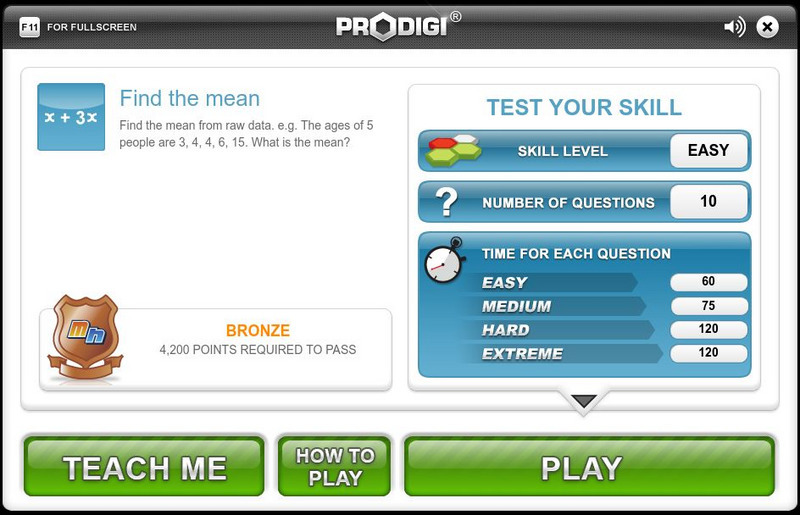
Mangahigh: Data: Find the Mean
Students learn about the concept of mean by exploring a tutorial. They can then test their knowledge by taking a ten question assessment that increases in difficulty as they correctly answer questions.
Mangahigh
Mangahigh: Data: Find the Mean From a Table
This site provides students practice with the concept of finding the mean. Students can learn about the topic by completing an interactive tutorial. Students can then take a ten question timed test to practice the skill.
Mangahigh
Mangahigh: Data: Estimate the Mean Using Grouped Results
Students watch an online tutorial on the concept of estimating the mean. After watching, students test their knowledge by attempting ten practice problems that increase or decrease in difficulty based on their answers.
Mangahigh
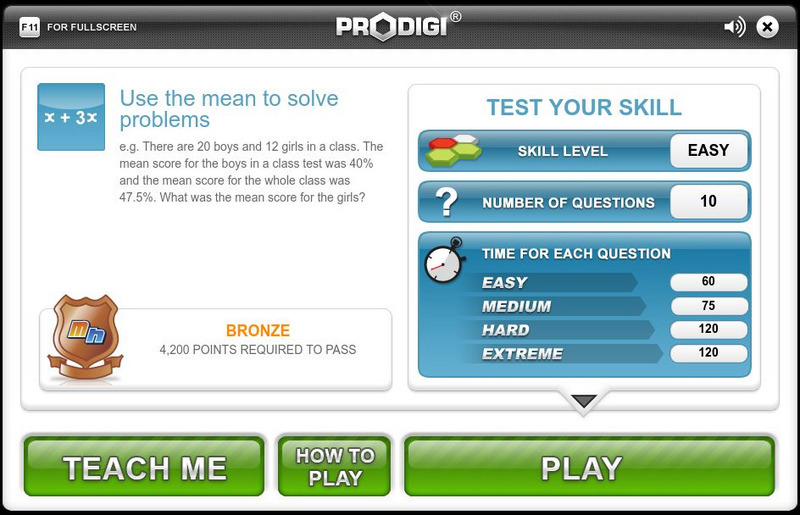
Mangahigh: Data: Use the Mean to Solve Problems
This site provides students practice with the concept of mean. Students can learn about the topic by completing an interactive tutorial. Students can then take a ten question timed test to practice the skill.
Other
Raymond Geddes and Company, Inc.: Analyzing Product Price and Sales Data
Lesson plan provides a real-world application of mean, median, mode, and range.
CK-12 Foundation
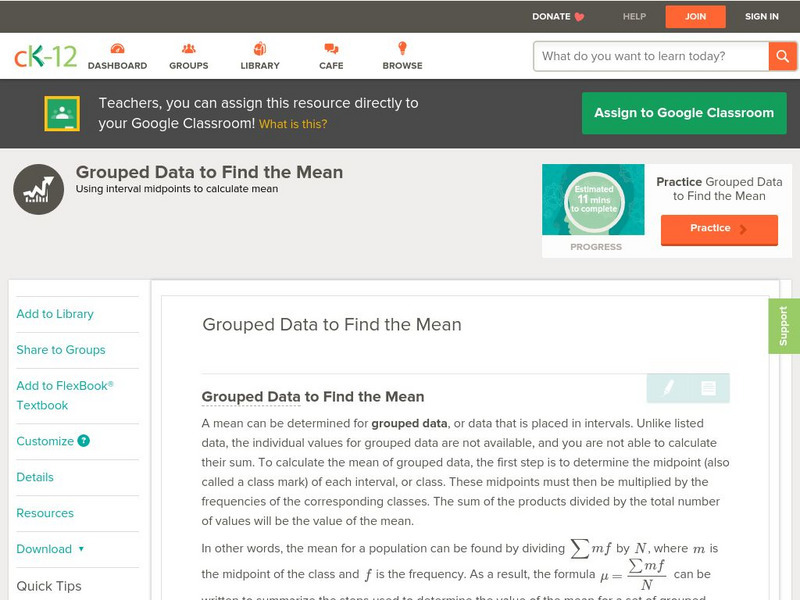
Ck 12: Statistics: Grouped Data to Find the Mean
[Free Registration/Login may be required to access all resource tools.] Covers frequency distribution tables with grouped data.
CK-12 Foundation
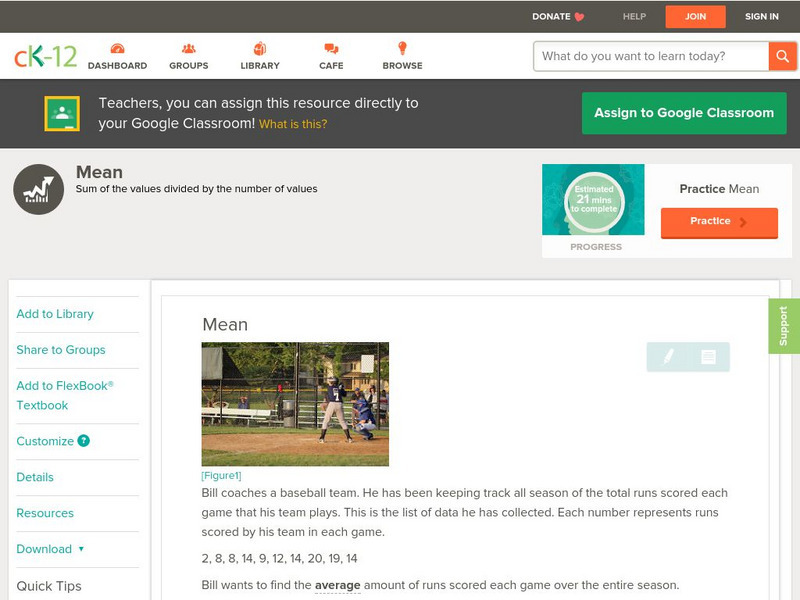
Ck 12: Statistics: Mean Grade 6
[Free Registration/Login may be required to access all resource tools.] Determine the mean, or average, in a given set of data.






![Pbs Mathline: Bubble Mania [Pdf] Lesson Plan Pbs Mathline: Bubble Mania [Pdf] Lesson Plan](https://d15y2dacu3jp90.cloudfront.net/images/attachment_defaults/resource/large/FPO-knovation.png)


