University of Illinois
University of Illinois: Measures of Central Tendency
This site provides valuable information regarding measures of central tendency. Also, clicking on the link gives valuable examples to clarify understanding.
Khan Academy
Khan Academy: Discrete Random Variables: Expected Value
Compute the expected value given a set of outcomes, probabilities, and payoffs. Students receive immediate feedback and have the opportunity to try questions repeatedly or receive hints.
Illustrative Mathematics
Illustrative Mathematics: S Id Sat Scores
Students will find solutions for a series of questions based on the assumption that SAT mathematics scores for a particular year are approximately normally distributed with a mean of 510 and a standard deviation of 100. Explanation and...
Illustrative Mathematics
Illustrative Mathematics: S Id.3 Describing Data Sets With Outliers
For certain data sets, such as home prices and household or individual income, is often described using the median instead of the mean. This lesson explores the mean and median in some different situations to help you understand the...
Illustrative Mathematics
Illustrative Mathematics: S Id.4 Do You Fit in This Car?
Students are tasked with solving a common issue for automobile manufacturers that require the students to use normal distribution as a model for data distribution. They will also use mean and standard deviation to figure out the problem....
Illustrative Mathematics
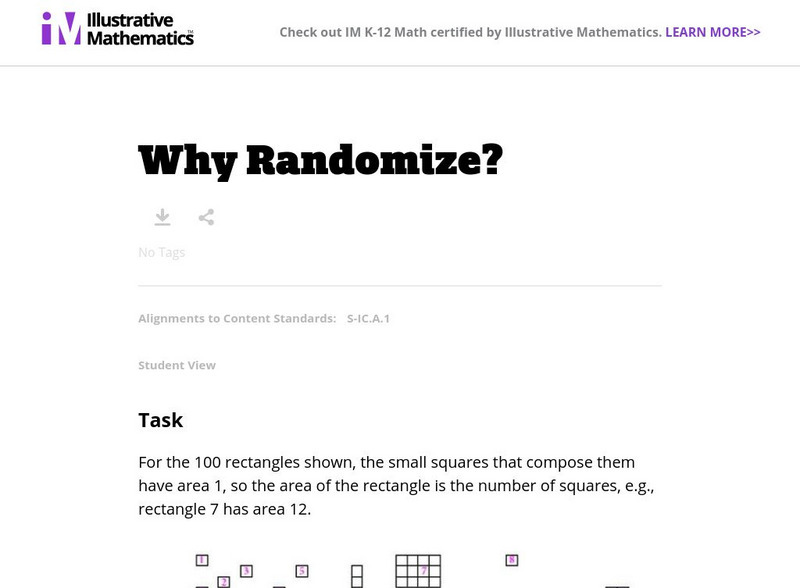
Illustrative Mathematics: S Ic Why Randomize?
The exercise demonstrates that judgment (non-random) samples tend to be biased in the sense that they produce samples that are not balanced with respect to the population characteristics of interest. Students will estimate the mean...
Illustrative Mathematics
Illustrative Mathematics: S Id.4 Should We Send Out a Certificate?
Should Fred receive a certificate for scoring in the top 2.5% of a statewide standardized test? Given the test scores for a large population and the mean and standard deviation, students will decide if Fred's score is good enough....
Illustrative Mathematics
Illustrative Mathematics: S Md.2 Bob's Bagel Shop
The purpose of this task is to assess a student's ability to compute and interpret an expected value. Notice that interpreting expected value requires thinking in terms of a long-run average. Students will help Bob the bagel man find the...
Illustrative Mathematics
Illustrative Mathematics: 6.sp4, 5c Puzzle Times
A performance task asking students to create a graph of provided information and then find the mean and the median of the data.
Other
Magoosh: Statistics Fundamentals
An online course on the fundamentals of statistics including video lessons in Mean, Median, and Mode; Weighted Averages; Quartiles and Boxplots; Range and Standard Deviation; Normal Distribution; Z-scores; Intro to Inferential...
Illustrative Mathematics
Illustrative Mathematics: Hss md.a.2
Three activities asking students to calculate the expected value of a random variable and interpret it as the mean of the probability distribution. Tasks include Bob's Bagel Shop, Fred's Fun Factory, and Sounds Really Good! (sort of).
NC State University
Nc State University: 4.2 (Cont.) Expected Value of a Discrete Random Variable
A PowerPoint explaining and showing examples of how to measure the mean of the values of a random variable.
Khan Academy
Khan Academy: Mean (Expected Value) of a Discrete Random Variable Practice
A practice word problem asking students to calculate the mean of B in a probability chart.
Purple Math
Purplemath: Mean, Median, Mode, and Range
Mean, median, and mode are three kinds of "averages". The "mean" is the "average" you're used to, where you add up all the numbers and then divide by the number of numbers. The "median" is the "middle" value in the list of numbers. To...
Palomar Community College District
Palomar College: Mode, Median, Mean Examples
A series of step-by-step worked problems demonstrating how to take a set of data and produce the measures of central tendency. Hints are provided along the way and the final measures are shown for the user to check.
CK-12 Foundation
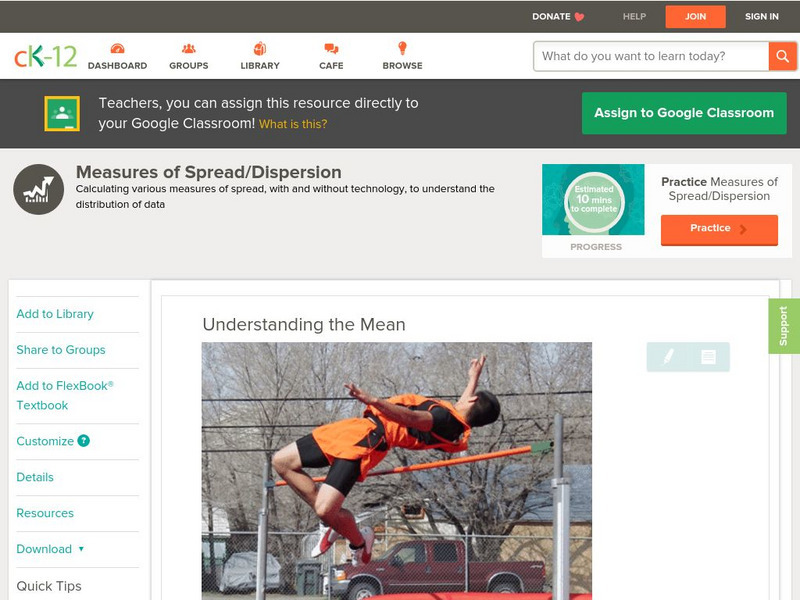
Ck 12: Statistics: Measures of Spread/dispersion Grade 8
[Free Registration/Login may be required to access all resource tools.] Understanding the mean and statistical deviations.
CK-12 Foundation
Ck 12: Summary Statistics: Summarizing Univariate Distributions
[Free Registration/Login may be required to access all resource tools.] This concept teaches students about other measures of center such as the mid-range, trimmed means and weighted mean. It also introduces the concept of percentiles,...
CK-12 Foundation
Ck 12: Mean and Standard Deviation of Discrete Random Variables
[Free Registration/Login may be required to access all resource tools.] This Concept teaches students how to find the mean and standard deviation for discrete random variables.
CK-12 Foundation
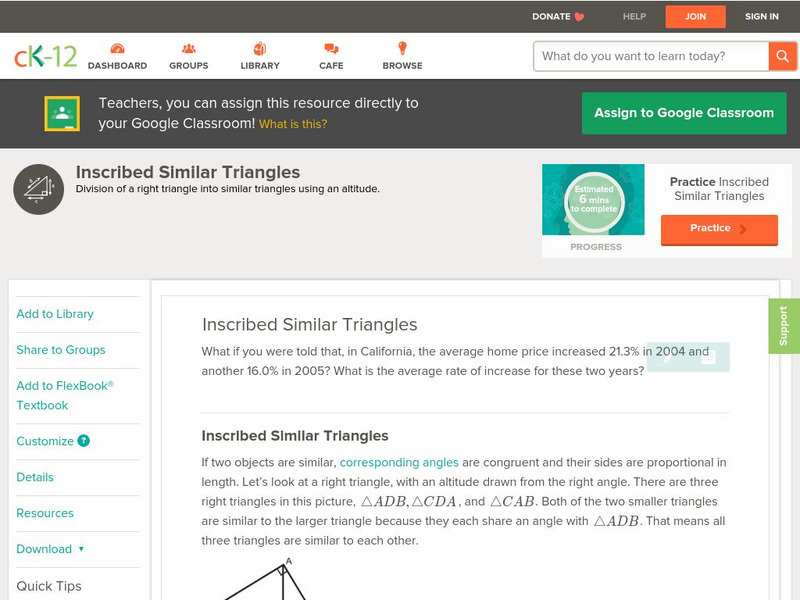
Ck 12: Geometry: Inscribed Similar Triangles
[Free Registration/Login may be required to access all resource tools.] This concept teaches students how to apply similarity to solve for missing information in inscribed right triangles.
Beacon Learning Center
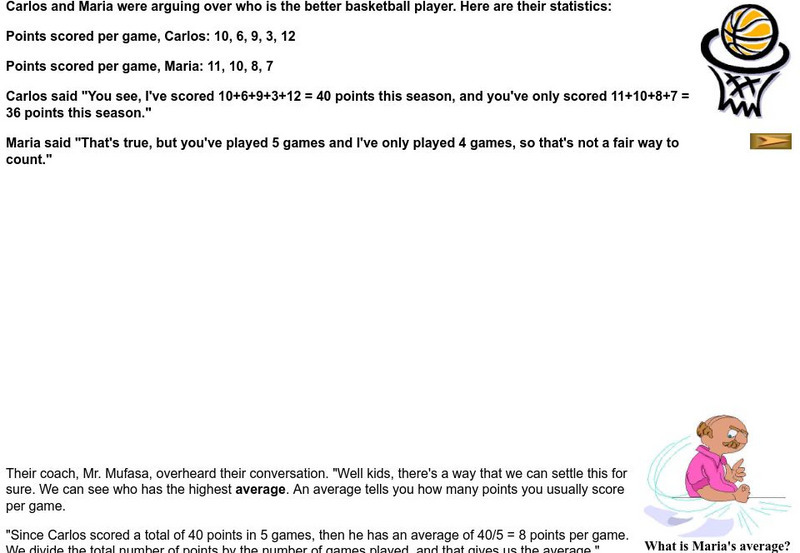
Beacon Learning Center: Basketball Means
Students explore and practice calculating averages in this interactive web lesson.
Alabama Learning Exchange
Alex: "Ridin' Along in My Automobile"
Students will research prices of used cars to discover how automobiles lose their value over time. Students will create a chart to record their information, use their chart to graph their data, and find measures of central tendency of...
Alabama Learning Exchange
Alex: Estimation Station
During this lesson, students will learn the difference between estimation and guessing. Knowing how to estimate is an essential skill that will help students determine approximate totals as well as check the reasonableness of their...
Alabama Learning Exchange
Alex: The Mean, Median, and Mode Chain Gang
Cooperative learning groups and chain links are used to find the mean, median, and mode. A Science NetLinks lesson is linked for further real-life application in the world of baseball (optional). This lesson plan was created as a result...
Better Lesson
Better Lesson: What Does the Data Tell Us? Describing Data
Understanding how to interpret data by its shape, spread, and center helps students to understand statistics.


