CK-12 Foundation
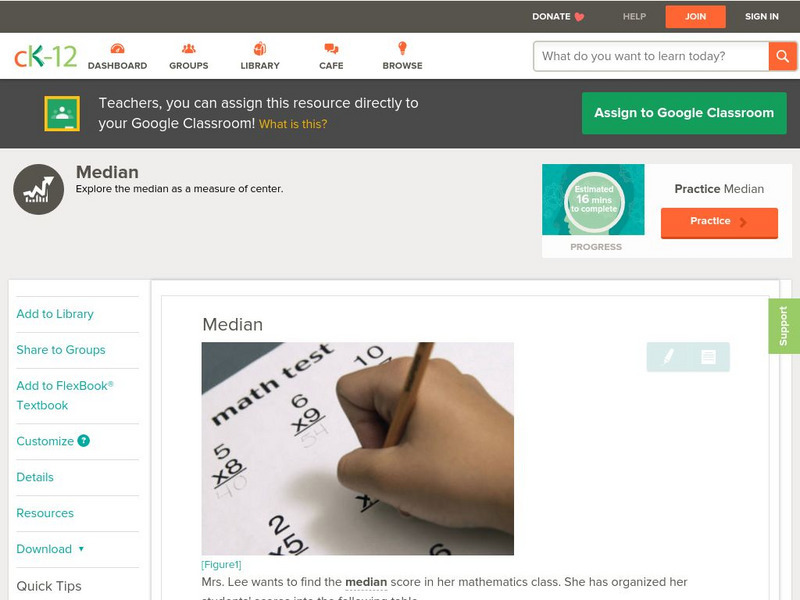
Ck 12: Statistics: Median Grade 7
[Free Registration/Login may be required to access all resource tools.] Find the median of a set of data.
CK-12 Foundation
Ck 12: Statistics: Median of Large Sets of Data
[Free Registration/Login may be required to access all resource tools.] Find the median of large sets of data.
CK-12 Foundation
Ck 12: Statistics: Mode Grade 6
[Free Registration/Login may be required to access all resource tools.] Determine the mode in a given set of data.
CK-12 Foundation
Ck 12: Statistics: Stem and Leaf Plots Grade 7
[Free Registration/Login may be required to access all resource tools.] Draw and use stem-and-leaf plots to display and organize data.
CK-12 Foundation
Ck 12: Statistics: Two Sided Stem and Leaf Plots
[Free Registration/Login may be required to access all resource tools.] Covers two-sided stem-and-leaf plots.
Khan Academy
Khan Academy: Practice: Calculating the Median
Practice ordering a set of data and then finding the median of the data set.
Khan Academy
Khan Academy: Calculating the Median
Practice finding the median of a data set. Students are able to check their answers, view a solution, and watch a video or use a hint.
Varsity Tutors
Varsity Tutors: Hotmath: Practice Problems: Statistics
Fifteen problems presented on the topics: mean, median, mode, outliers and graphing statistics. They are given with each step to the solution cleverly revealed one at a time. You can work each step of the problem then click the "View...
CK-12 Foundation
Ck 12: Statistics: Quartiles
[Free Registration/Login may be required to access all resource tools.] Order a set of data and understand the measures needed for a box-and-whisker plot.
CK-12 Foundation
Ck 12: Measures of Central Tendency and Dispersion Grades 9 10
[Free Registration/Login may be required to access all resource tools.] Decide which measure of central tendency best describes a data set.
CK-12 Foundation
Ck 12: Statistics: Stem and Leaf Plots, Mean, Median, and Mode
[Free Registration/Login may be required to access all resource tools.] Find the mean, median, and mode of a set of data displayed in a stem-and-leaf plot.
CK-12 Foundation
Ck 12: Physical Science: Descriptive Statistics
[Free Registration/Login may be required to access all resource tools.] Explains descriptive statistics (mean, median, mode, range).
Math Slice
Math Slice: Mean, Median, Mode and Range
This resource allows students to practice finding mean, median, mode and range. Students are able to select parameters that include a number range, length of sequence, and an option to work on one or all including mean, median, mode and...
Khan Academy
Khan Academy: Median & Range Puzzlers
These conceptual problems really make you think! Getting through this exercise will deepen your understanding of median, range, and data sets in general. Students receive immediate feedback and have the opportunity to try questions...
Khan Academy
Khan Academy: Calculating the Median: Data Displays
Practice computing the median of data sets presented in a variety of formats, such as frequency tables and dot plots. Students receive immediate feedback and have the opportunity to try questions repeatedly, watch a video or receive hints.
Khan Academy
Khan Academy: Calculating the Median
Practice finding the median of a data set. Like the mean, the median gives us a sense of the middle or center of the data. Students receive immediate feedback and have the opportunity to try questions repeatedly, watch a video or receive...
Sophia Learning
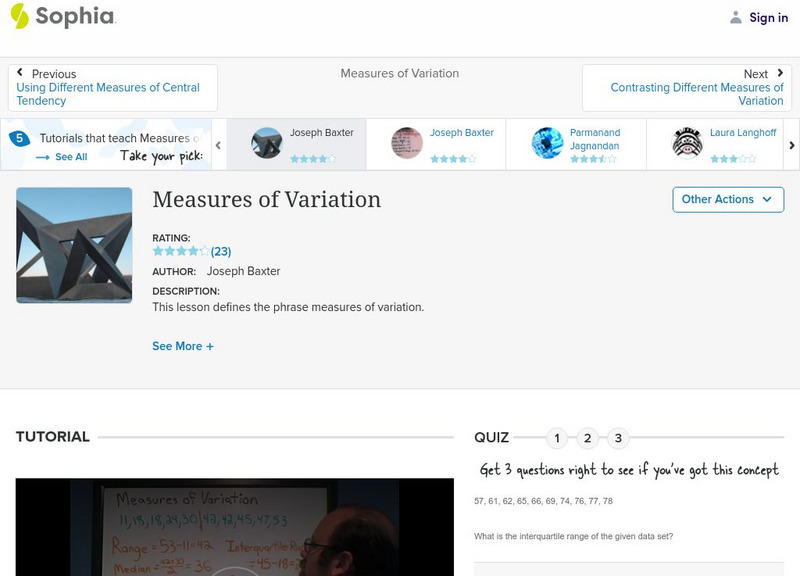
Sophia: Measure of Variation
Explore the measures of variation and check understanding with an assessment.
CK-12 Foundation
Ck 12: Statistics: Median Grades 9 10
[Free Registration/Login may be required to access all resource tools.] Find the median of a set of data.
BBC
Bbc Revise Wise Maths: Mode, Median, Mean
This website from the BBC is a great introduction to averages (mean, median, and mode) and will take you through some interactive learning activities. A practice test and worksheet are also provided.
Annenberg Foundation
Annenberg Learner: Drawing a Box Plot
Learn how to represent the Five-Number Summary graphically using a box plot.
BBC
Bbc Skillswise: Averages and Range
BBC Skillswise provides multiple factsheets, quizzes, activities, and worksheets on averages and variations.
Shodor Education Foundation
Shodor Interactivate: Lesson: Box Plots
This lesson plan introduces quartiles and box plots. It contains an activity and discussion. Supplemental activities about how students can represent data graphically are also included.
Beacon Learning Center
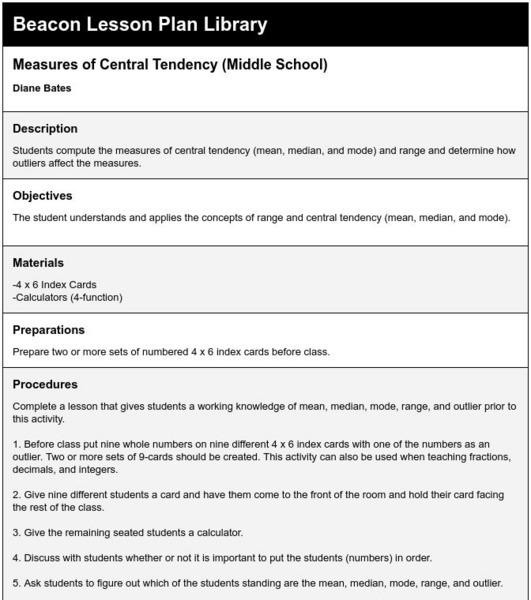
Beacon Learning Center: Measures of Central Tendency (Middle School)
Lesson plan provides practice for calculating measures of center.
Analyze Math
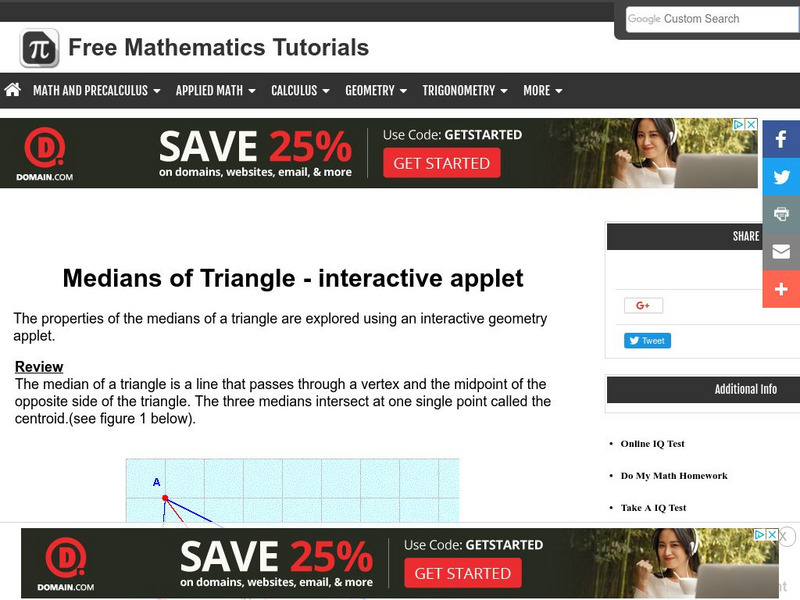
Analyze Math: Medians of Triangle
The properties of the medians of a triangle are explored using an interactive geometry applet.


