Education Development Center
Tune in to Learning: Understanding Mean, Median and Mode
Have you ever wondered what the difference is with mean, median, and mode? Here are some exercises that will help you understand what each is.
Science Education Resource Center at Carleton College
Serc: Using Your Hair to Understand Descriptive Statistics
Enhance students' understanding of various descriptive measures with a visual interpretation of a mean, median, outlier, and the concept of distance-to-mean.
University of North Carolina
University of North Carolina Writing Center Handouts: Statistics
When presenting an argument, the use of statistics to support a point can be very effective. This handout offers advice on both how to read statistics so that you understand exactly what they mean, and how to use them in your argument so...
Texas A&M University
Wtamu Virtual Math Lab: Beginning Agebra: Central Tendencies
A tutorial to understand the three central tendencies and how to find them, as well as the standard deviation of values. Offers a discussion and practice problems.
University of Illinois
University of Illinois: Measures of Central Tendency
This site provides valuable information regarding measures of central tendency. Also, clicking on the link gives valuable examples to clarify understanding.
Illustrative Mathematics
Illustrative Mathematics: S Id Haircut Costs
This lesson could be used as an introductory lesson to introduce group comparisons. Being able to use data to compare two groups is an important skill. Students will sketch box plots using the data given about the cost of haircuts for...
Illustrative Mathematics
Illustrative Mathematics: S Id.3 Describing Data Sets With Outliers
For certain data sets, such as home prices and household or individual income, is often described using the median instead of the mean. This lesson explores the mean and median in some different situations to help you understand the...
Illustrative Mathematics
Illustrative Mathematics: 6.sp4, 5c Puzzle Times
A performance task asking students to create a graph of provided information and then find the mean and the median of the data.
Other
Magoosh: Statistics Fundamentals
An online course on the fundamentals of statistics including video lessons in Mean, Median, and Mode; Weighted Averages; Quartiles and Boxplots; Range and Standard Deviation; Normal Distribution; Z-scores; Intro to Inferential...
Purple Math
Purplemath: Mean, Median, Mode, and Range
Mean, median, and mode are three kinds of "averages". The "mean" is the "average" you're used to, where you add up all the numbers and then divide by the number of numbers. The "median" is the "middle" value in the list of numbers. To...
Palomar Community College District
Palomar College: Mode, Median, Mean Examples
A series of step-by-step worked problems demonstrating how to take a set of data and produce the measures of central tendency. Hints are provided along the way and the final measures are shown for the user to check.
CK-12 Foundation
Ck 12: Measures of Central Tendency and Dispersion Grades 8 9
[Free Registration/Login may be required to access all resource tools.] Learn how to calculate different measures of central tendency, as well as the spread or dispersion of the data.
CK-12 Foundation
Ck 12: Measures of Central Tendency and Dispersion Grades 11 12
[Free Registration/Login may be required to access all resource tools.] This Concept introduces students to the most common measures of central tendency: the mean, median and mode.
CK-12 Foundation
Ck 12: Measures of Central Tendency and Dispersion Grade 8
[Free Registration/Login may be required to access all resource tools.] Find the mean, median, mode and range of a data set.
CK-12 Foundation
Ck 12: Statistics: Box and Whisker Plots Grade 6
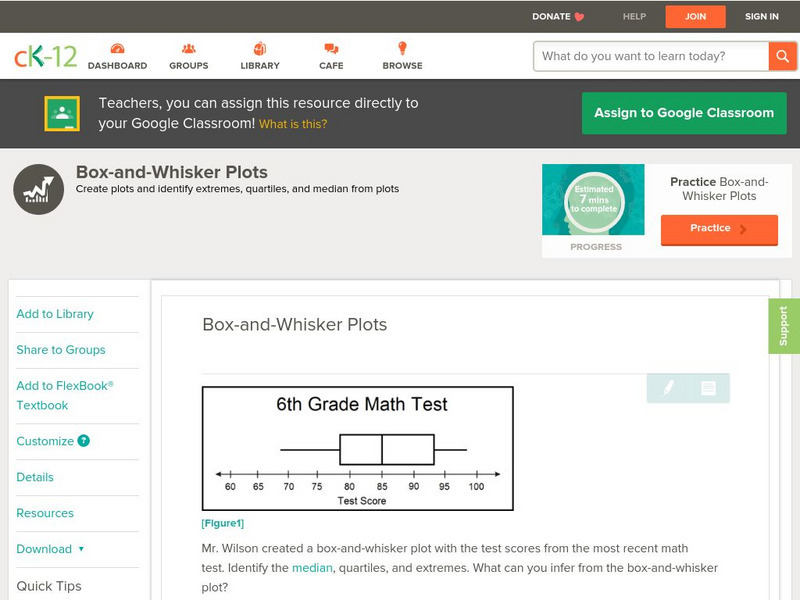
[Free Registration/Login may be required to access all resource tools.] Draw and analyze a box-and-whisker plot.
CK-12 Foundation
Ck 12: Geometry: Medians
[Free Registration/Login may be required to access all resource tools.] Apply the Median Theorem.
Other
Gobierno De Navarra: Puntos Y Rectas Notables De Un Triangle
Learn how to construct the bisectors, median and altitude of a triangle.
Alabama Learning Exchange
Alex: "Ridin' Along in My Automobile"
Students will research prices of used cars to discover how automobiles lose their value over time. Students will create a chart to record their information, use their chart to graph their data, and find measures of central tendency of...
Alabama Learning Exchange
Alex: Estimation Station
During this lesson, students will learn the difference between estimation and guessing. Knowing how to estimate is an essential skill that will help students determine approximate totals as well as check the reasonableness of their...
Alabama Learning Exchange
Alex: The Mean, Median, and Mode Chain Gang
Cooperative learning groups and chain links are used to find the mean, median, and mode. A Science NetLinks lesson is linked for further real-life application in the world of baseball (optional). This lesson plan was created as a result...
Better Lesson
Better Lesson: What Does the Data Tell Us? Describing Data
Understanding how to interpret data by its shape, spread, and center helps students to understand statistics.
Better Lesson
Better Lesson: Analyze This Part 2!
Srudents connect mean, median, mode and range to real life. It will allow students to make sense of problems by using previously taught strategies.
CK-12 Foundation
Ck 12: Geometry: Bisectors, Medians, Altitudes Study Guide
This study guide on bisectors, medians, and altitudes covers key vocabulary, different theorems, and facts about the altitude and triangles. It is available for download with free registration.
National Council of Teachers of Mathematics
Nctm: Illuminations: Mean and Median
This applet allows the user to investigate the mean, median, and box-and-whisker plot for a set of data that they create.


