Curated OER
Dynamic Data Range, Mode, and Median
Learners practice statistics skills by calculating range, mode, and median. In this 4th - 6th grade lesson plan, students calculate range, median, and mode of given numbers while playing a game.
Curated OER
Range and Mode
In this data interpretation worksheet, 2nd graders review the definitions of range and mode. They use the information from a data table to answer 5 questions about the children in after-school clubs.
Curated OER
Data Analysis
In this data analysis worksheet, students answer 4 questions using a weather report chart. Topics include mean, median, mode and range.
Curated OER
Range and Mode Practice 4.5
In this range and mode worksheet, students study a data table that shows the ages of children in a school play. Students solve 5 problems pertaining to the range and mode of the information.
Curated OER
Mean, Median, Mode, and Range: Reteach
For this line plots worksheet, students review how to make a line plot to show data and review the steps to find mean, median, mode, and range. Students then make a line plot for the data in exercise 1 and use it to answer the remaining...
Curated OER
Data Analysis Self-Test
In this data analysis worksheet, students complete 1 problem that has 7 parts involving mean, median, mode, range, and quartiles. Students then perform 5 operations with matrices.
Curated OER
Statistics
In this statistics worksheet, 7th graders solve and complete 5 different problems related to determining various statistics. First, they find the average of a given set of numbers. Then, students find the median and mode of each set of...
Curated OER
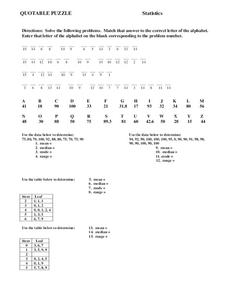
Statistics
In this statistics worksheet, 8th graders solve and complete 15 different problems. First, they solve each problem by using the data given to determine the mean, median, mode, and range for each set. Then, students match that answer to...
Curated OER
Statistics
In this statistics worksheet, 9th graders solve and complete 8 different problems that include various measures of central tendency. First, they find the mean, median, and mode for each set of data. Then, students find the median and...
Curated OER
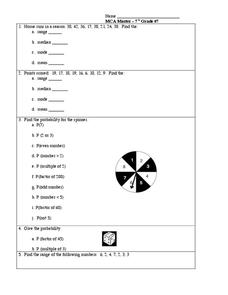
Probability and Statistics
In this probability and statistics activity, students complete 5 problems regarding range, mean, median, mode, and a spinner probability problem.
Curated OER
Stem-and-Leaf Plots
In this stem-and-leaf plots learning exercise, 8th graders solve and complete 3 different problems that include creating stem-and-leaf plots to solve problems. First, they determine the median, minimum, range and mode of the given set of...
Curated OER
Measures of Central Tendency
In this measures of central tendency worksheet, learners find the mean, mode and range of given sets of data. They interpret box-and-whisker graphs and stem-and-leaf plots. This two-page worksheet contains eleven multi-step problems.
Curated OER
Range and Mode
In this graphing worksheet, 2nd graders focus on the range and the mode with the given data provided. Students study the chart and respond to four short answer questions.
Curated OER
Mean, Mode, Median
In this mean, mode, and median worksheet, 8th graders solve and complete 6 different problems that include determining the mean, mode and median of various sets of numbers. First, they explain how to determine the median, mode and mean....
Curated OER
Stem and Leaf Plots
In this stem and leaf plots worksheet, students solve and complete 10 different problems that include designing stem and leaf plots. First, they use the table on the left to determine the least score and the range of the total scores...
Curated OER
Statistics
In this statistics worksheet, 8th graders solve 4 problem sets related to an introduction to statistics. First, they find the range of each set of data. Then, students find the median and mode of each set of data. In addition, they...
Curated OER
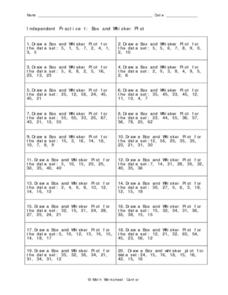
Independent Practice 1: Box and Whisker Plot
In this box and whisker plot activity, students create a box and whisker plot from a given set of data. They identify the lower quartile, upper quartile, the mean, and outliers. This one-page activity contains 20 sets of numbers from...
Curated OER
Middle Most Numbers and Division
In this middle most numbers worksheet, students examine a set of given data. They place the numbers in order from least to greatest and identify the mean of the set. This one-page worksheet contains six division problems.
Curated OER
Averages and Percentages
In this averages and percents learning exercise, students identify and define average as all numbers together divided by the total number of items added. Then they identify and define percent as the given number out of a total possible....
Curated OER
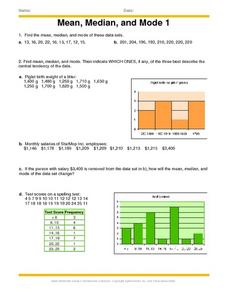
Mean, Median, and Mode 1
For this mean, median and mode worksheet, students use the measures of central tendency to describe given statistical data. Students identify the range of data, and match data to its representative bar graph. Two multi-step problems...
Curated OER
Means, Medians, and Modes
In this math worksheet, learners find the mean, median, and mode for each set of numbers. Then they apply the methods to the word problems.
Curated OER
Mean, Median And Mode 1
In this mean, median and mode worksheet, students problem solve and calculate the answers to ten word problems associated with the mean, median and mode of collected data.
Curated OER
Measures of Central Tendency: Pages 178-183
In this math worksheet, students find the mean, median and mode for 2 stem and leaf tables, 4 number sets. Students also find a set of numbers for given mean, median and mode.
Curated OER
Mean, Mode, Median, and Range
In this math worksheet, learners read about the mean, mode, median, and range. Students analyze a color-coded example problem for each.


