Curated OER
Measures of Central Tendencies: Quartiles
In this statistics worksheet, students calculate the mean, median, mode, range, lower quartile, and upper quartile for 10 questions and interpret a box and whiskers graph.
Curated OER
Making Data Meaningful
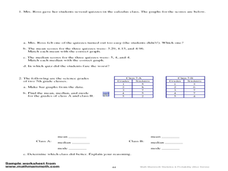
In this sample mean worksheet, students explore different ways "average" is used. Students use this information to find the sample mean of the height of a large class of students. Students find the mean, median, mode and range of two...
Curated OER
Beyond Averages: Median, Mode and Range
In this median, mode and range learning exercise, students complete a set of 10 multiple choice questions, clicking on an answer link to view correct answers.
Curated OER
Describing Data
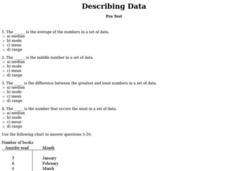
In this data activity, students complete multiple choice questions about mean, median, mode, and range. Students complete 10 questions total.
Curated OER
Describing Data
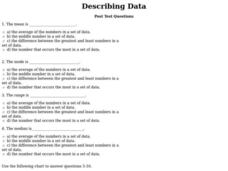
For this describing data worksheet, students answer multiple choice questions about mean, median, mode, and range. Students complete 10 questions total.
Curated OER
Mean, Median, and Mode
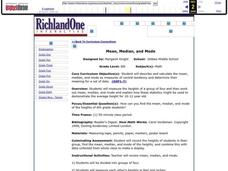
Young scholars calculate measures of central tendency. in this mean, median, and mode lesson, students calculate the measures of central tendency. They organize data, examine and explain the statistics.
Curated OER
Campaign 2000
Students research newspapers and the Internet to learn about the election. Students work in groups and choose a state that they want to compare to Florida. Students organize the data they have found into a graph labeling an "x" and "y"...
Curated OER
Mean, Median, and Mode
In this mean, median, and mode worksheet, students find the mean, median, and mode for 4 sets of numbers and answer short answer questions about them. Students answer 5 short answer questions.
Curated OER
Mean, Mode and Bar Graphs
In this mean, mode and bar graphs worksheet, 5th graders analyze the data given, then answer three questions about a bar graph and the data shown.
Curated OER
Using mean, median, and mode
In this mean, median, and mode activity, students read how to use each method and then complete problems using each one. Students complete 8 problems.
Curated OER
Chapter Books
In this line plot instructional activity, students create a line plot of the chapter books read by the students of a class and find the median and mode. Students complete 3 tasks.
Curated OER
Describing Range and Measures of Central Tendency in Shoe Sizes
Students describe the range and various measures of central tendency using shoe sizes from a video. In this range and measures of central tendency lesson plan, students use the same data set to identify the concepts of range, mode,...
Curated OER
Range and Mode
Fifth graders interpret data. In this mode and range lesson plan, 5th graders define mode and range and practice finding them given a set of data.
Curated OER
Mean, Median and Mode
Fourth graders describe weather data using the mean, median and mode. In this mean, median and mode lesson, 4th graders understand how to calculate data using mean, median and mode and why they would use each one.
Curated OER
Range and Mode
Students interpret data from graphs. In this range and mode activity, students review a tally chart, pictograph and bar graph. Students use these graphs to calculate the range and mode of each set of data.
Curated OER
Out to Lunch
Sixth graders create a menu. In this math lesson, 6th graders use mean, median and mode to determine the prices for the typical cost of an appetizer, entree, kid's meal, drinks and dessert. Students write a number sentence to show how...
Curated OER
Averaging
Sixth graders explore the concept of mean, median, mode, and range. In this mean, median, mode, and range lesson, 6th graders work in groups to find the mean, median, mode, and range of their heights, distance from home to school, time...
Curated OER
Averages
In this averages worksheet, 6th graders solve and complete 3 various types of problems. First, they find the mean, mode, median and range for each set of data shown. Then, students match each team to the picture shown that they think...
Curated OER
Data Analysis
In these data analysis worksheets, students complete 4 worksheets of activities for analyzing data. Students use the mean, median, mode, and range to organize the data.
Curated OER
Mode, Median, and Mean
Students define mode, median and mean, and perform mathematical operations to determine these 3 terms. In this statistics/math lesson, students practice memory strategies to help distinguish between mode, median, and mean. Students apply...
Curated OER
Mode, Median, and Mean
In this measures of central tendency worksheet, students determine the mode, median, and mean of a given data set based on children's test scores. They fill in a tally chart and answer 6 questions based on the data.
Curated OER
Frequency Table
In this frequency table worksheet, students create a frequency table from given data. They identify the mode. Students read and interpret frequency tables. This one-page worksheet contains 7 multi-step problems.
Curated OER
Median and Mode
In this median/mode worksheet, students solve 6 problems, using a table of students and their heights in centimeters. Students find median, mode, outliers and arrange data from least to greatest.
Curated OER
Mean, Median and Mode
For this mean, median and mode worksheet, students solve 6 problems involving mean, median and mode. Students are given a "hint" for problems 1 and 2.


