Teacher Created Resources
How to Calculate Discounts and Sales
Teach discounts and sales with a straightforward worksheet. After reviewing the concept, pupils solve word problems related to dollars and percentages. The second half of the sheet prompts learners to continue solving problems related to...
Beyond Benign
Product Test
It's the moment of truth. Previous lessons in the 24-part series had scholars design and develop shampoo formulas using chemical concepts. The 18th lesson asks them to test the function of their shampoos. To do this, they calculate the...
Beyond Benign
SLS Toxicology Test
Ingredients in your shampoo are toxic enough to kill plants. The 16th installment of the series of 24 tests the toxicity level of various concentrations of SLS, a chemical found in nearly all shampoo. Learners prepare percent solutions...
Beyond Benign
PPM
The 15th lesson in the series of 24 helps your classes understand the ppm (part per million) unit of measure. First, scholars experiment with food coloring to determine concentrations before applying their findings to calculate...
Beyond Benign
In a Lather
Time to come clean! Scholars continue preparing the shampoo they created in the previous two lessons. The purpose of this stage is to calculate the perfect amount of additive to make the shampoo lather.
Beyond Benign
Can You Hear Me Now? Cell Phone Accounts
How sustainable are cell phones? Throughout the unit, learners explore the issues around cell phones concerning sustainability. Class members take a graphical look at the number of cell phones across the world using a box-and-whisker...
Beyond Benign
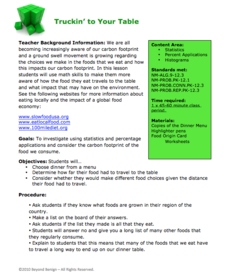
Truckin’ to Your Table
Food takes a trip to the table. Class members choose a meal from a menu and calculate the total cost of the meal including tax and tip. Using a food origin card, pupils determine how far each of the ingredients of a meal traveled to end...
CK-12 Foundation
Simple Random Sampling: How Many Samples Does it Take to Change a Light Bulb?
Teach the concept of simple random sampling through an interactive lesson. Learners explore the concept by considering the strength of sampling methods. Size of the samples varies also as individuals determine which methods lead to the...
CK-12 Foundation
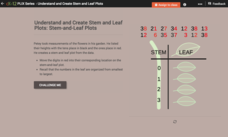
Understand and Create Stem-and-Leaf Plots: Stem-and-Leaf Plots
Explore the advantages to using a stem-and-leaf plot using an online lesson. Learners manipulate an animation to create a stem-and-leaf plot. They then calculate statistics for the data using their display. Guiding questions help them...
CK-12 Foundation
Understand and Create Stem-and-Leaf Plots: Event Survey
A good lesson doesn't just grow on trees! Help your classes understand the concept of a stem-and-leaf plot using an interactive lesson. Learners first create a stem-and-leaf plot from a set of data by dragging the values to the plot....
CK-12 Foundation
Frequency Polygons: Constructing a Frequency Polygon
Connect the dots on frequency. Given a distribution table of scores on an assessment, learners create a frequency polygon by moving points on a graph to the correct frequency. The pupils use the display to answer questions about the...
CK-12 Foundation
Pie Charts: Soda Party
Using the interactive, pupils create a pie chart that represents the percentage of sodas bought for a party. Individuals need to determine the percentage and number for the final variety of drinks. The learners determine how the...
CK-12 Foundation
Displaying Categorical Variables: Spending Habits
Bar or circle graph—which is best? Given a circle graph and a total amount of money earned, pupils calculate the amount of money in each category. Learners use the calculated amounts to create a bar graph and compare the two displays.
CK-12 Foundation
Data Summary and Presentation: Chart for Grouping Data
Get social! Create a display of social media use for a class. Pupils use provided information about the time spent on social media to construct a histogram. Using the histogram, learners interpret the data to answer questions.
Roald Dahl
Matilda - Bruce Bogtrotter and the Cake
After reading the 11th chapter in Matilda, class members take on the role of Bruce Bogtrotter and re-enact the cake eating scene. Here's the catch: they must come-up with an impromptu re-enactment of the scene from the story, and use...
CK-12 Foundation
Complement Rule for Probability: Changes in an Election
Pupils determine the probability of one mayoral candidate winning given the other's chance. The interactive provides a circle graph to help visualize each candidate's percentages of winning.
NASA
Resolving 2-Plane Traffic Conflicts by Changing Speed—Problem Set E
What do you do to change arrival times of airplanes when a different route is not available? The fifth interactive in a series of six presents problems where pupils must find solutions to conflicts of safety rules. They must decide how...
CK-12 Foundation
Applications of Linear Systems: Alcohol Solution in Nursing
Solve alcohol systems to find the right solution. The interactive allows pupils to manipulate the amount of a solution and displays the total amount in a mixture. Individuals determine the amount of each solution needed to make 15 liters...
CK-12 Foundation
Percent of a Number: Rock Climbing
What percent of the 100 ft. rock has Marta climbed? Young mathematicians find the percent of number (the rock height) by moving the climber up and down the rock.
Virginia Department of Education
Sales Tax and Tip
Don't forget to tip your server. Future consumers learn how to calculate sales taxes and tips. Pairs use actual restaurant menus to create an order and determine the total bill, including taxes and tips.
CK-12 Foundation
Conversions between Degrees and Radians: Charting Hours in the Day
Forget hours, divide the day into radians instead. Class members convert the angles in a pie chart of daily activities into radian measures. They add angle measures for multiple activities then determine a relationship between the radian...
EngageNY
Solving Percent Problems III
What happens when combining percentage discounts? The last lesson in a series of 29 introduces the idea of combining discounts one after another. Pupils wrestle with the claim that to find the total discount, they need to only add the...
EngageNY
Percent of a Quantity
Visualize methods of finding percents. Classmates find a percent of a quantity using two methods including a visual model in the 26th lesson in a series of 29. By the end of the lesson, scholars find percents given a part and the whole...
EngageNY
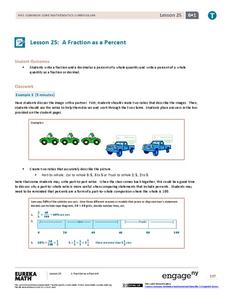
A Fraction as a Percent
It is all about being equivalent. Class members convert between fractions, decimals, and percents. By using visual models, scholars verify their conversions in the 25th portion of a 29-part series.


