Curated OER
Asthma "Outbreak" Exercise
Students investigate numerical data on a possible asthma epidemic. Using statistical information, students graph and figure ratios of the epidemic. They evaluate the mortality rate from severe smog in the 1950's in London.
Curated OER
Probability
Sixth graders explore probability. They analyze a class chart and list the letters of the alphabet according to frequency. Using the data collected, they complete probability problems.
Curated OER
What's the Deal with Probability?
Eighth graders examine probability. Students read real life situations involving math. Upon completing probability problems, they express their answer as a fraction, decimal or percent.
Curated OER
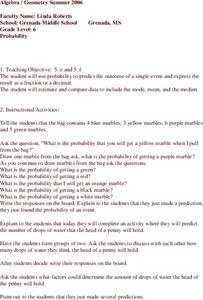
Probability
Sixth graders study the probability of single events. Given a bag of marbles, they discuss and find the probability of single events. In groups of two, 6th graders complete additional activities, predicting the probability. Students...
Curated OER
Playing With Probability
Sixth graders investigate probability. They use ratios to solve simple probability situations. Students express their solutions in the form of fractions or decimals. They predict outcomes and complete probability worksheets.
Curated OER
Finding the Probability
Ninth graders investigate the concept of probability. They use a clear objective that is a visual cue for what is required for the lesson. They apply the basic practices of probability to real life like situations.
Curated OER
Exploring Probability
Fourth graders participate in a lesson that explores probability. They use candy and model cubes to experiment with different outcomes that can be charted if the students can proceed to the objective of the lesson. They discover how...
Curated OER
Data Analysis, Probability, and Discrete Math: Lesson 5
Eighth graders are read the material that is printed in boldface type inside the boxes. Information in regular type inside the boxes and all information outside the boxes should not be read to them. They then find the mean, median,...
Curated OER
POPCORN SCIENCE!
Students work in groups to define what popcorn is, what kinds of popcorn they eat, and hypothesize what happens when popcorn pops. They also weigh, pop and weigh their popcorn again, measuring how many popcorn kernels they started with...
Curated OER
Theoretically Speaking
Students define probability. They determine outcome from a given situation based on simple probability. Students create experimental data using a coin and a number cube. They write how theoretical and experimental probability are different.
Curated OER
Modeling Forest Fires Using Probability
Young scholars explore forestry. They discuss creating fire breaks to control forest fires. Students create models to determine the best way to manage forest fires. They discuss current techniques of forest management.
Curated OER
The Colored Cube Question
Fourth graders examine how to determine the probabilities or likelihood of outcomes. They complete trials to determine probability while using different manipulatives. They determine how games can be made fair or unfair in this unit of...
Curated OER
Making Decisions with Probability
Students explore probability. They discuss the likelihood of events happening and the terms certain, impossible, likely and unlikely. Students discuss various situations and the likelihood of that situation occurring.
Curated OER
Who Plays What?
Ninth graders divide in pairs 3 cards with the words possible, impossible and certain on them. Ask questions of the class and get the students to hold up the word that describes the event (for example) Tomorrow it will snow. You have...
Curated OER
Hypothesis Testing: Top Ten Singles
Students review and better examine hypothesis testing and evaluation of probability distributions. the use of the discovery method is vital to the studying because it is about student interests which helps for motivation.
Curated OER
Grade 3: Pretzel Probability
Third graders discuss prizes included in products to stimulate sales. They discuss a pretend pretzel company and it's sticker promotion. Students compute how many boxes of pretzels they will need to collect in order to be sure of having...
Curated OER
Probability and ICT Integration
Eighth graders use the internet and calculators to explore theoretical and experimental probability. Using a program on the calculator, 8th graders simulate a coin toss and a spinner to figure probability. They also perform classroom...
Curated OER
Time For Breakfast
This unit encourages students to assess the validity of a set of statements and then plan and carry out investigations to find out whether the statements are true. Students then carry out statistical investigations of their own.
Curated OER
Exploring Probability
Fourth graders play a dice game as a group and record the number rolled. They report their findings and discuss terminology and ways of writing what the odds are of getting certain numbers.
Curated OER
Chaos
Students experiment with several chaotic simulation, they build a working definition of chaos. Students reinforce their knowledge of basic probability and percents. They are reminded of previous knowledge that is pertinent to this...
Curated OER
Unexpected Answers
Students explore and complete a variety of activities demonstration probability. They make observations about the results of the activities. Students complete and discuss conditional probability. Also, students draw conclusions about...
Curated OER
Probability
Fifth graders are introduced to the concept of probability. Using dice, they identify which rolls have the greatest chance of occuring after completing an experiement in which they roll the dice and graph the results. They explain...
Curated OER
Chances Are: Talking Probability
Students explore probability and the process of data analysis and predictions. They participate in two activities, one involving a calculator and one the Internet, in which they make predictions and conduct activities to test their...
Curated OER
The Car Pool is Coming
Students evaluate the number of people who travel out of their town to work. They figure out what the percentage of each town's commuting workers is to the number who commute in the region. They plot the percentages on a pie chart.


