CK-12 Foundation
Ck 12: Statistics: One Way Anova Tests
[Free Registration/Login may be required to access all resource tools.] This Concept demonstrates how to use ANOVA to compare multiple means as pairs of hypotheses.
Sophia Learning
Sophia: Box and Whisker Plots
Explore how to display data using a box and whisker plot.
Sophia Learning
Sophia: Facts
This lesson clarifies what writers mean when using the term "facts." This tutorial lesson shares a short slideshow with the lesson's content.
Sophia Learning
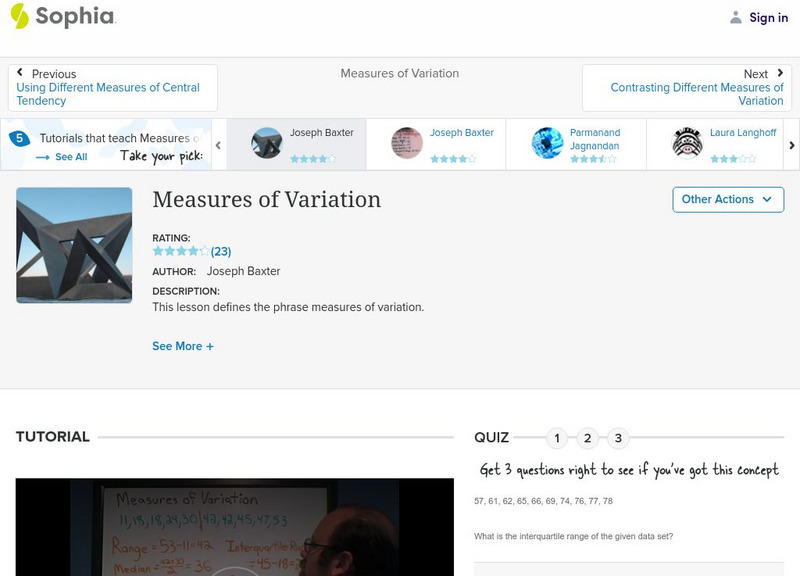
Sophia: Measure of Variation
Explore the measures of variation and check understanding with an assessment.
Sophia Learning
Sophia: Supporting Details: Facts and Statistics
This lesson discusses how statistics can be used as supporting details. This tutorial shares a short audio lesson [05:16] and supplemental notes with the lesson's content.
CK-12 Foundation
Ck 12: Statistics: Bar Graphs Grades 9 10
[Free Registration/Login may be required to access all resource tools.] Make a bar graph to display given data.
CK-12 Foundation
Ck 12: Statistics: Double Bar Graphs Grades 9 10
[Free Registration/Login may be required to access all resource tools.] Covers double bar graphs.
CK-12 Foundation
Ck 12: Statistics: Median Grades 9 10
[Free Registration/Login may be required to access all resource tools.] Find the median of a set of data.
CK-12 Foundation
Ck 12: Statistics: Mode
[Free Registration/Login may be required to access all resource tools.] Find the mode of a set of data.
CK-12 Foundation
Ck 12: Statistics: Multiple Line Graphs
[Free Registration/Login may be required to access all resource tools.] Make multiple line graphs to display and compare given data.
CK-12 Foundation
Ck 12: Statistics: Planning and Conducting Surveys
[Free Registration/Login may be required to access all resource tools.] Design and conduct surveys and analyze and interpret the results.
Texas Instruments
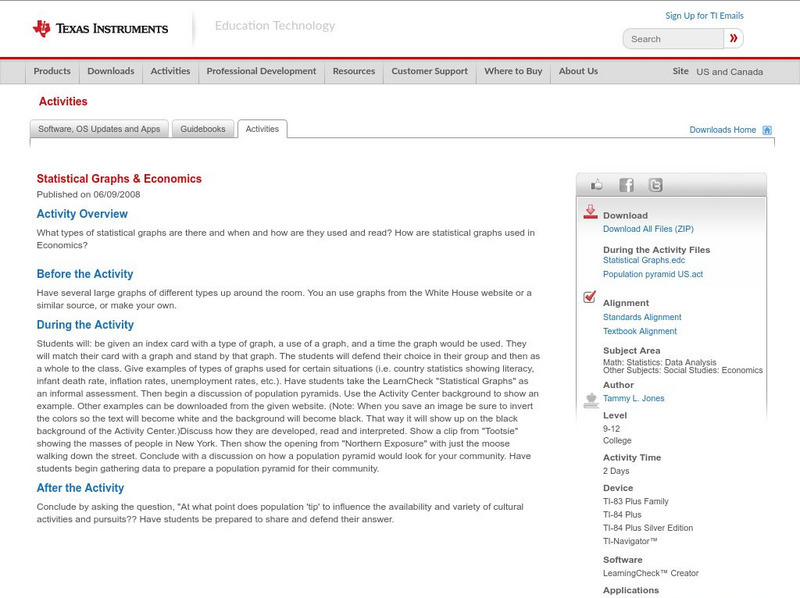
Texas Instruments: Statistical Graphs & Economics
What types of statistical graphs are there and when and how are they used and read? How are statistical graphs used in Economics?
Other
Vlps: Mean and Standard Deviation
Explanation of frequency distributions, mean, standard deviations, and variance including a Java Applet.
Duke University
Connected Curriculum Project: Matrix Operations: Part 3: Special Matrices
This site explores the properties of several different types of matrices.
University of Baltimore
University of Baltimore: Statistical Data Analysis: Outlier Removal
Outliers are data items which lie very far below or very far above the "majority" of the data in a set. Here you will find the steps to take to correctly identify whether a data set has outliers as well as how to remove them. Written by...
CK-12 Foundation
Ck 12: Algebra: Applications of Function Models
[Free Registration/Login may be required to access all resource tools.] In this lesson students draw a scatter plot of data, find and draw the function that best fits that data, and make predictions from that information. Students watch...
Rice University
Hyper Stat Online Statistics Textbook: Chapter 3: Describing Bivariate Data
This chapter of an online textbook begins with a description of scatterplots, then focuses on the Pearson Product Moment Correlation.
University of North Carolina
University of North Carolina Writing Center Handouts: Statistics
When presenting an argument, the use of statistics to support a point can be very effective. This handout offers advice on both how to read statistics so that you understand exactly what they mean, and how to use them in your argument so...
National Council of Teachers of Mathematics
The Math Forum: Drexel Math Forum: Adventures in Statistics
This lesson incorporates problem-solving and data collection to satisfy a fifth grade class's curiosity about the size of their classroom with respect to a sixth grade classroom.
National Council of Teachers of Mathematics
The Math Forum: Traffic Jam Activity Lesson Plan
There are seven stepping stones and six people - three on the left facing the three on the right. How is it possible to have the three on the left end up on the right, and vice versa, while everyone was at all times standing on a stone...
Sophia Learning
Sophia: Supporting Details Explained
This slideshow focuses on supporting details; it discusses their purpose, the audience, and the point to be made. It lists the five most common types of supporting details: facts, statistics, opinions, examples, and personal observations...
University of Arizona
Pulse: Powerful Explorations of Health and Energy
A cross curricular unit where students simulate an energy task meeting to discuss protecting human health through energy policies. The unit covers content for twelfth grade in math, physics, language arts, and government. Topics reviewed...
US Mint
U.s Mint: Which Side Is Which [Pdf]
Introduce learners to the Louisiana Purchase and Lewis and Clark's Expedition. Then take a look at the Peace Medal nickel and differentiate between heads and the tails sides. Finally, do a coin-flip activity, and record and analyze the...
Northern Illinois University
The Mathematical Atlas: Probability Theory and Stocha
This site from the Northern Illinois University gives general background information on probability and also includes books and other websites that contain information on Probability.










![U.s Mint: Which Side Is Which [Pdf] Lesson Plan U.s Mint: Which Side Is Which [Pdf] Lesson Plan](https://content.lessonplanet.com/knovation/original/249033-ff1ff264a293b5ffb6c4bba64baec78d.jpg?1661243090)