Curated OER
Usage and Interpretation of Graphs
Students explore graphing. In this graphing lesson, students predict how many shoe eyelets are present in the classroom. Students count eyelets and work in groups to organize and chart the data collected. Students put all the data...
Curated OER
Histograms and Bar Graphs
Students examine the use of bar graphs and histograms. In this data representation lesson, students investigate the proper use of bar graphs and histograms to represent data. They learn the proper geometric definitions, experience direct...
Curated OER
Learning to Make Line Graphs
Students analyze data and create a line graph. In this graphing lesson, students explore data from a previous experiment and plot the information on a line graph. Students analyze their findings.
Curated OER
Statistics Related to the First World War
In this history and probability worksheet, students examine a chart of statistics associated with World War I which include total of men in the war by nation, number of deaths, and number of men taken prisoner. They answer 5 questions...
Curated OER
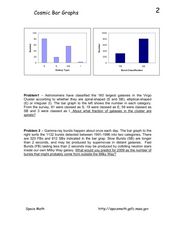
Cosmic Bar Graphs
In this cosmic bar graph worksheet, students solve 2 problems using given bar graphs that plot the number of galaxies vs. the galaxy type and the number of gamma-ray bursts vs. the burst classification. Students find the fraction of...
Curated OER
Watermelon Graphing
Students discover bar graphs. In this primary math lesson plan, students identify the parts of watermelon seeds and other seeds. Students learn the proper names and common names which refer to the parts of the seeds as they create a bar...
Curated OER
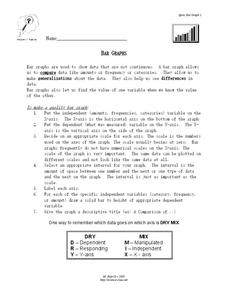
Bar Graphs
In this bar graph worksheet, students read about making quality bar graphs and they make a bar graph using given data. They answer 5 questions about their graph.
Curated OER
Baster Bonnets Sold
In this graphing worksheet, students look at a bar graph and answer questions. Students review a graph showing the number of Easter bonnets sold by color and number. Students then answer five questions about the graph. Students become...
Curated OER
Olympic Bar Graphs
For this Olympic bar graph worksheet, students pick a sport from the 2004 Olympic games and find data from the Olympic web page. They graph the scores (times, distance, or speed) and the medals. They answer questions about the variables...
Curated OER
Sorting and Analyzing
Learners explore sorting and graphing. In this math instructional activity, students create and analyze a class bar graph about their birthday months. They then estimate and sort candies to make and analyze their own bar graph.
Curated OER
Graphs - Online Activity
In this interpreting graphs worksheet, students complete an on-line activity in which they read both a line graph and a bar graph. They answer questions about how many of each letter is shown on a line graph and how many of each child's...
Curated OER
Choose an Appropriate Graph
In this graphs learning exercise, students solve 6 fill in the blank problems where they choose the most appropriate type of graph for each set of data and explain why they chose that type. Students use bar graphs, histograms and circle...
Curated OER
Sort and Graph
In this sorting and graphing worksheet, students sort 15 objects and then fill in bar graphs to tell how many of each shape there are. The shapes are: heart, star and triangle.
Curated OER
Double Bar Graphs (Reteach 15.1)
In this graphs worksheet, students analyze the data on two double bar graphs. Students answer 4 questions about the information on the graphs.
Curated OER
Human Population Growth
In this human population growth worksheet, learners create a graph of human population growth and predict future growth using the data given in a chart. Students identify factors that affect population growth.
Curated OER
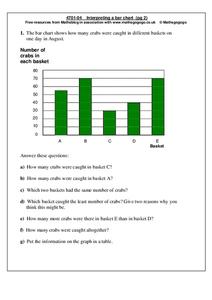
Interpreting a bar chart
In this bar chart worksheet, students analyze a bar chart and answer 7 questions pertaining to the information on the chart. The answers are on the second page.
Curated OER
Animal Runners
In this collecting data worksheet, 4th graders use the data shown on how fast 6 animals can run to create a bar graph. Students follow the instructions on 3 directives for their bar graphs and answer 1 short answer question.
Curated OER
Favorite Fruit
In this graphing activity, 1st graders create a bar graph showing the favorite fruits of their classmates. They analyze their bar graph by answering five comprehension questions.
Math Mammoth
Bar Graphs 1
In this bar graph activity, students organize data in a frequency table, then create a bar graph. They find the average of the data. This one-page activity contains two multi-step problems.
Curated OER
Favorite Pet
In this math worksheet, 2nd graders study the pictograph of favorite pets. Students then answer nine questions pertaining to the given graph.
Curated OER
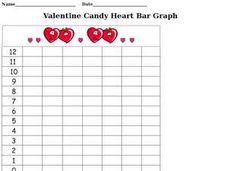
Valentine Candy Heart Bar Graph
In this Valentine candy heart bar graph worksheet, learners complete a bar graph illustrating how many different colored candy hearts they received for Valentine's Day.
Curated OER
Which Instrument is Your Favorite To Listen To?: Graph
In this favorite instrument bar graph worksheet, students will ask their classmates which is their favorite to listen to: drums, guitar, flute, piano, saxophone, or trumpet? Then students will record the responses to complete the graph.
Curated OER
How Do You Feel Today?: Graph
In this feeling bar graph worksheet, students will ask their classmates how they feel today and record the responses to complete the graph.
Curated OER
Which Habitat Would You Enjoy Living in the Most?: Graph
In this favorite habitat bar graph worksheet, students will ask their classmates which habitat they would enjoy living in the most and record the responses to complete the graph.


