Curated OER
Fast Food Survey Using Bar Graphs
Second graders create a bar graph to pictorically represent the data collected from a survey of students. They use Excel to electronically create the graphs and data tallies. They then interpret their data using sentences to explain.
Curated OER
Raising the Bar While Hogging the Ham (Radio, That Is)
Young scholars watch a Cyberchase video to determine the importance of using the correct scale when making bar graphs. They examine how to use bar graphs to gain information easily. They determine how to use bar graphs persuasively.
Curated OER
Math Lesson: What Do You Want to Know? - Country Statistics
Students are able to identify the characteristics of a variety of graphs (i.e. bar graph, line graph, pie graph, scatter plot, population pyramids, etc.) They recognize how the type of data to be presented plays a role in choosing the...
Curated OER
Fruit Loop Graphing
Fifth graders interpret data and create graphs. Given Fruit Loops, they sort and classify according to color. Using spreadsheet technology, 5th graders record their data and create bar and circle graphs. Students analyze data and...
Curated OER
Measuring Inches
First graders measure the length of pipe cleaners to form worms using rulers to focus on inches. They record their results and graph the measurement of each pipe cleaner. They measure their pipe cleaner "worms" in various colors and...
Curated OER
Graphic Accounts
Learners identify the use of different types of bar graphs. They analyze graphs used in the New York Times to compare the estimated cost of the war in Iraq to other hypothetical expenditures and reflect on how graphs can help illustrate...
Curated OER
Graphing the Annual Food Drive
Students graph the number of items contributed to the food drive. They compare daily results to other days or to an overall goal and answer questions based on the graph.
Curated OER
Graphing
Learners collect data to create different types of graphs-line, pie, and bar graphs. They use StarOffice 6.0 to create graphs.
Curated OER
M&M Graphing and Probability
Students sort, classify, and graph M & M's. They create pictographs and bar graphs with the colors and numbers in each bag of M & M's. They calculate the ratio and probability based on class results.
Curated OER
Circle Up Your M&Ms
Fifth graders estimate how many M&Ms are in a pre-counted bag. They determine how many colored M&Ms are in a bag, then decide which of the two, bar graph or circle graph (in this case, circle graph) would be best to show te results.
Curated OER
ELECTRICITY 1
Fifth graders examine the importance of electricity to their everyday lives, practice plotting and interpreting data on a bar graph, and reflect in their journals about how their lives would change without electricity.
Curated OER
Hollywood's Top Ten
Young scholars gather data on top 10 highest grossing movies, and make a bar graph and a pictogram.
Curated OER
Graphing With Candy
Students gather information and interpret the results using a tally chart, a table, and a bar graph.
Curated OER
Best-Selling Books Bar Graph
Create a bar graph with your elementary school learners. First they read and interpret data, and then they color in the graph (provided) to indicate how many of each were sold. Consider providing them with the data but having them...
Curated OER
Math Word Problems: Reading Bar Graphs
In this math word problems-reading bar graphs worksheet, students analyze the bar graph and answer six questions about the data in the graph.
Curated OER
Graphs to Represent a Data Set
Here are the number of animals Jackson saw at the zoo; scholars organize data into bar graphs using this worksheet. Encourage labeling, but consider having scholars do these on another sheet because there isn't room for the x-axis to be...
Curated OER
Statistics for Graphing
Students use the Internet to access a variety of websites that present statistics and information for use in graphing. They represent sports statistics, geographical measurements, temperatures and more.
Curated OER
How Does Your Animal Move?---Class Bar Graph
Animals move in interesting ways! Get your young learners to examine various types of animal movement in this group graphing activity. Although directions are not explicit, it seems students are assigned an animal and categorize the...
Curated OER
Using M&M's to Teach Bar Graphs
Motivate your class with this lesson. While not fully fleshed out, this activity is meant to be used as an introduction to the use of bar graphs. Learners sort M&M's and create bar graphs to display their information.
Curated OER
Misleading Graphs
Students explore number relationships by participating in a data collection activity. In this statistics instructional activity, students participate in a role-play activitiy in which they own a scrap material storefront that must...
Curated OER
Favorite Season
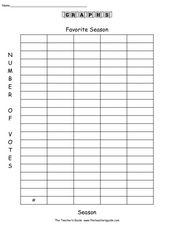
In this graphing worksheet, students conduct a survey of people's favorite survey. They then complete 8 questions about the data gathered before creating a bar graph and pictograph on templates.
Pennsylvania Department of Education
Up on Top
Students make bar graphs and identify items in the bar graphs as being likely, certain, or impossible. In this bar graphs lesson plan, students answer questions about the bar graphs using reasoning and communication skills.
Curated OER
North vs. South
Students use information about the Union and Confederate troops to create a bar graph. For this graphing lesson, students graph troop information on a bar graph, color coding the information. Students then find the differences between...
Curated OER
Graphing in the Form of Bar Graphs
Young scholars explore bar graphs. In this math lesson, students create and conduct a survey. Young scholars graph their data in a bar graph.


