Curated OER
Fourth Grade Mathematics Quiz
For this math worksheet, 4th graders complete multiple choice questions about multiplication, bar graphs, rounding, and more. Students complete 15 questions.
Curated OER
Applied Science-Science and Math (2A) Post Lab
Second graders create a graph about TV watching. In this bar graph lesson plan, 2nd graders make a hypothesis about how much TV 2nd graders watch per week. They record their TV watching for a week and bring it to school to create a class...
Curated OER
Interpreting Graphs
Students investigate graphs. In this graphing lesson, students create a graph regarding the population of California. Students extrapolate answers concerning the data set.
Curated OER
Temperature Bar Graph
Students explore mean, median and mode. In this math lesson, students analyze temperature data and figure the mean, median, and mode of the data. Students graph the data in a bar graph.
Curated OER
Graphs
In this bar graph worksheet, 6th graders complete word problems based on a bar graph of number of cans of food collected. Students complete 8 problems.
Curated OER
Graphs
In this graphs learning exercise, students complete word problems about a bar graph of tickets sold for the drama club. Students complete 8 problems.
Curated OER
Bar Graphs
In this bar graph instructional activity, students complete word problems about a bar graph containing the results of student's rock collections. Students complete 8 problems.
Curated OER
Data and Graphs
In this data and graphs activity, students complete multiple choice questions about which bar graphs represent the data given and complete a bar graph based on data given. Students complete 3 problems.
Curated OER
Graphs
In this bar graph worksheet, students answer questions for a bar graph that is about students taking part in a math class. Students complete 6 problems total.
Curated OER
Introduction to Dr. Seuss
First graders look at slides on the SMART Board of different facts about Dr. Seuss and then create a class bar graph of their favorite Dr. Seuss books. In this Dr. Seuss lesson plan, 1st graders review and list facts that they learned...
Curated OER
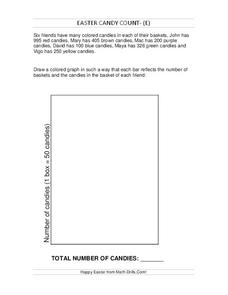
Easter Candy Count
In this bar graph worksheet, students fill in the bar graph based on the information about Easter candy that each child got. Students complete 6 spaces in the bar graph and find the total number of candies.
Curated OER
Easter Candy Count
For this bar graph worksheet, students complete a bar graph based on the information of Easter candy they are given for each color. Students complete 6 spaces in the bar graph and find the total.
Curated OER
Easter Candy Count
In this bar graph worksheet, students fill in the bar graph with the information of Easter candy that each child has and find the total. Students fill in 6 bars in the bar graph.
Curated OER
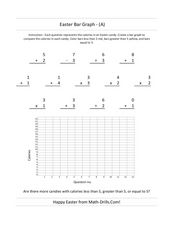
Easter Bar Graph- A
In this Easter math activity, students first solve 13 problems with addition, subtraction, multiplication and division. Using the answers, students make a bar graph.
Curated OER
Easter Bar Graph - C
In this math review learning exercise, students complete addition, multiplication, division, and subtraction problems where each answer is inserted into a bar graph. Students complete 13 problems.
Curated OER
Easter Bar Graph - (E)
In this math review worksheet, students complete addition, multiplication, division, and subtraction problems where each answer is put into an Easter bar graph. Students complete 13 problems.
Curated OER
Easter Bar Graph - (B)
In this math review worksheet, students complete addition, subtraction, multiplication, and division problems and put their answers into a bar graph that represents calories. Students complete 13 problems and 1 graph.
Curated OER
Easter Bar Graph - (D)
In this math review worksheet, students complete addition, multiplication, division, and subtraction problems where each answer is put into an Easter bar graph. Students complete 13 problems.
Curated OER
Easter Candy Count
In this bar graph worksheet, students complete a bar graph based on the information of Easter candy they are given for each color. Students complete 6 spaces in the bar graph and find the total.
Curated OER
Easter Candy Count
In this bar graph worksheet, students complete a bar graph based on the information of Easter candy they are given for each color. Students complete 6 spaces in the bar graph and find the total.
Curated OER
Bar Graphs and Data Analysis
In this graphing worksheet, students look at a bar graph of allowance and dollars. They answer 6 questions related to the bar graph.
Curated OER
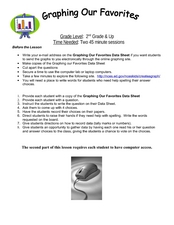
Graphing Our Favorites
Second graders use a computer program to follow directions and graph their favorite things into a bar graph. In this graphing lesson plan, 2nd graders have 30 choices of favorite things to graph.
Curated OER
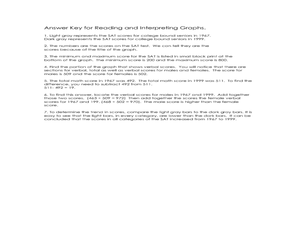
Reading and Interpreting Graphs Worksheet
In this bar graphs instructional activity, students read and interpret a bar graph on SAT scores by answering short answer questions. Students complete 7 questions total.
Curated OER
Learning to Read Graphs
In this learning to read graphs worksheet, students look at the graph showing children's favorite colors, then write how many children like each of the 4 colors.


