Curated OER
Professor Panda's Pizza Graph
In this data analysis worksheet, students answer 11 questions using a bar graph that was constructed from the answers to a survey about pizza toppings. They use a secret code to determine the best place to have a pizza.
Curated OER
Graphing in the Information Age
Students create a variety of graphs based on population data. In this statistics instructional activity, students use data that can be gathered on-line to make a bar chart, line graph, and circle graph.
Curated OER
Deciding Which Type of Graph is Appropriate
In this graphing instructional activity, students read about line, bar, and pie graphs and then determine which graph is the best way to express data results. This instructional activity has 3 short answer questions.
Curated OER
Double Bar Graphs
In this double bar graphs practice worksheet, students sharpen their problem solving skills as they solve 6 story problems.
Curated OER
Travel Fun
In this bar graph worksheet, students survey classmates about their favorite way to travel. Students then fill in one square for each response creating a horizontal bar graph.
Curated OER
Read a Bar Graph
In this bar graph worksheet, students use a bar graph of favorite zoo animals to solve 6 simple word problems. Houghton Mifflin text is referenced.
Curated OER
Problem Solving: Use a Graph: Problem Solving
In this bar graph worksheet, students read the word problem and use the bar graph to complete the problem solving questions for understand, plan, solve, and look back.
Curated OER
Match Game: Enrichment
In this solid figures worksheet, learners choose a shape from the box that fits the bar graph totals for the faces, edges, and vertices. Students then complete the last bar graph using the one unused shape.
Curated OER
Make and Read Bar Graphs
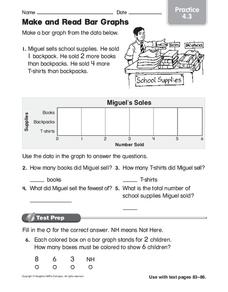
In this bar graphs worksheet, students make a bar graph about the sale of school supplies with the data presented in one story problem.
Curated OER
Frequency Tables and Histograms
In this graph worksheet, 5th graders study the data presented on a bar graph. Students then respond to 4 short answer questions using the information that has been provided.
Curated OER
Histograms: Practice
In this histograms worksheet, students use the bar graph histogram to answer questions 1-4 and the tally chart for question 5. Students finish with two test prep questions.
Curated OER
Use a Bar Graph: Practice
In this bar graph instructional activity, students use data in a bar graph to solve 2 word problems, 2 mental math problems and 1 multi-step problem. Reference to a Houghton Mifflin text is given.
Curated OER
Use a Bar Graph
In this bar graph worksheet, students use data from a bar graph to solve an addition sentence. To help students solve the problem they use the problem solving strategies of understand, plan, solve, and look back.
Curated OER
Activity: Make a Bar Graph
In this bar graph worksheet, students use a given picture to create a graph, then use the graph to solve 2 related problems. Graph is sports related.
Curated OER
Favorite Sports Graph
In this data collection and graph worksheet, students ask each classmate which sport is their favorite based on the ones shown at the bottom of the graph. They color a square for each response, and tell the most and least popular sport.
Curated OER
Write Larger Numbers in Words or Figures
In this reading a bar graph worksheet, students identify numbers to answer word questions. In this short answer worksheet, students answer five questions.
Curated OER
Interpreting a Bar Chart
For this interpreting bar charts worksheet, students examine a bar chart that shows how many people traveled on boats that took them out dolphin watching. They answer 8 questions about the times and number of people on the boats.
Curated OER
Using Data
In this analyzing data worksheet, 4th graders read, study and interpret a bar graph on how many hours Millie spends a week drawing each day. Students answer 2 short answer questions relating to the bar graph.
Curated OER
Making a Bar Graph
In this bar graph worksheet, students analyze a data table and bar graph depicting information about stickers collected. Students answer 5 questions about the data displayed.
Curated OER
Reading Bar Graphs
In this bar graphs worksheet, 8th graders solve and complete 10 different problems that include interpreting two different bar graphs. First, they determine the least profitable year for selling books. Then, students determine the age...
Curated OER
Bar Graph Questions
For this bar graph worksheet, students solve 10 problems in which information on a bar graph is used to calculate answers. This page is intended as an online activity, but may be completed with paper and pencil.
Curated OER
Collecting Data
In this data collection worksheet, students read about how data is collected and organized. They also learn about a hypothesis. Students read through examples of different charts and then answer 23 questions pertaining to data...
Curated OER
Trumpet of the Swan Favorite Character Graph
In this math and literature worksheet, students survey classmates about their favorite character in the book Trumpet of the Swan. Students display the data on this blank bar graph.
Curated OER
Surveying and Graphing- Favorite Character in Charlotte's Web
In this math and literature worksheet, students survey classmates about their favorite character in Charlotte's Web and display the data on a bar graph. The blank graph is unlabeled; there are no lists of characters to choose from.


