Curated OER
Making and Interpreting Tables
In this data tables worksheet, students make and interpret data tables given data about magazine sales. They categorize their data, complete their data table and answer questions about their data.
Curated OER
Experiment Report
In this experimental design activity, learners fill out their title, hypothesis, independent and dependent variables, data table, graph and conclusion for their lab.
Curated OER
Experimental Design Practice
In this experimental design worksheet, students are given two experimental scenarios to read. They answer questions about each including finding the hypothesis, the independent and dependent variables and controls. They design a graph...
Curated OER
2010 Census Lesson 1: It's About Us
Learners analyze data from the 2000 census to learn how the census works. In this civics lesson, students read a story to find out about the census, then use a map and census data to analyze changes. Lesson includes related resources...
Curated OER
Leveled Problem Solving: Histograms
In this using data, frequency table, and histogram to solve word problems worksheet, students solve problems about prices of toys and numbers of toys sold to solve consumer mathematics problems. Students solve six problems.
Curated OER
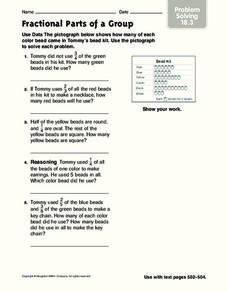
Fractional Parts of a Group
In this problem solving worksheet, students problems solve the answers to 5 mathematical word problems involving fractional parts. Students use data from a pictograph to assist them in solving each word problem.
Curated OER
Germination Inhibitors
In germination experiment worksheet, students conduct the following lab activity. Students determine the effects of another tomato on germinating seeds. Students answer the following questions to analyze their experiment.
Curated OER
Grade 3 Mixed Math Practice- Mars, X
For this grade 3 mixed math worksheet, 3rd graders complete 9 problems. They work with fractions, nets, line segments, elapsed time, and a data table. They draw the bar graph to go with the data, and practice mental multiplication.
Curated OER
Choose a Path
In this addition worksheet, students utilize data from a map to answer 6 fill in the blank questions where they provide the missing addends to addition problems.
Curated OER
Mean, Median, Mode, and Range
In this mean, median, mode, and range worksheet, students define and solve 5 detailed questions that include finding the mean, median, mode, and range of numbers. First, they calculate the mean, median, mode, and range for each set of...
Curated OER
Organizing Data
In this organizing data worksheet, 7th graders solve seven different types of problems related to data. They first identify the type of data as categorical, discrete or continuous from the information given. Then, students use Excel to...
Curated OER
Data Management and Probability: Applications
In this data management and probability applications learning exercise, 8th graders solve 20 various types of probability problems. They find the mean, median, mode and range of various numbers. Then, students use the spinner...
Math Mammoth
Decimal Problems
In this math worksheet, students are given tables and story problems with decimal points. Students must use the tables and story problems to find 10 answers about the data.
Curated OER
Graphing the Weather
Fourth graders predict the weather for their area using simple weather instruments. They take readings for a month during a season and graph their results. Students describe weather patterns based on their data and predict future weather...
Curated OER
These Maps are for the Birds
Students identify and study New York State Breeding Bird Atlas maps to learn where different bird species nest and how their distributions have changed over time. They also identify how maps serve as representations of a geographic...
Curated OER
Climographs
Students identify trends and characteristics of climate zones and specific places within. Then, they graph annual climate trends (primarily Temperature and Precipitation) and create, interpret and extrapolate information based on...
Curated OER
Handling Data
Students create a simple table in order to solve a problem. As a class, they create a simple data table in order to discover the number of letters in each student's name. This data is interpreted in order to answer questions and make...
Curated OER
Data Analysis and Probability
Students design models to simulate actual events using various random devices. They estimate the likelihood of a particular outcome using results of simulation. In addition, they simulate the births of three children to a using a coin.
Curated OER
Party Time
Students engage in a lesson about finding information from the grocery store to put into data that can be measured. The data is found in advertisements and food labels. They plan the cost of a party when using the unit cost of various...
Center of Excellence for Science and Mathematics Education
A Sick Astronaut
Aspiring astronauts graph, interpret, and analyze data. They investigate the relationship between two variables in a problem situation. Using both graphic and symbolic representations they will grasp the concept of line of best fit to...
Curated OER
Traveling Through the Solar System
Students use calculator and non-calculator methods for analyzing data. They apply data collection and analysis in a study of mass and weight. Students enhance and apply the concept of line of best fit. They master graphing in a plane,...
Curated OER
Introduction to Engineering Information Technology
Students demonstrate knowledge of information sharing skills by discussing each step with their group members. They demonstrate application of information sharing skills by working with a group to share specific pieces of data with...
Curated OER
Data Collection and Presentation
Young scholars access how to collect, classify and display data involving statistics. The concepts of quantitative, discrete and continuous data is covered in depth within the instructional activity. They practice with a scenario of...
Curated OER
Interpreting Data and Building Hypothesis
Students define the term species, and graph species data together with previously collected data at the National Zoo. They interpret graphed data and recognize patterns in the streamside quadrant versus hillside quadrant. Students use...


