Curated OER
Do You Like Cold Or Hot Lunch Better?: Graph
In this bar graph worksheet, students will ask classmates if they prefer hot or cold lunch and record answers to complete the graph.
Curated OER
Do You Like To Color With Crayons, Markers, Or Colored Pencils?: Graph
In this bar graph worksheet, students will ask classmates what they like to use when coloring: crayons, markers or colored pencils? Then students will record the responses to complete the bar graph.
Curated OER
If You Were a Community Helper for a Day, Which One Would You Like To Be?-- Class Bar Graph
For this math worksheet, learners collaborate to make a class bar graph. Students choose from a list of 12 occupations they are interested in and plot the information on the graph.
Curated OER
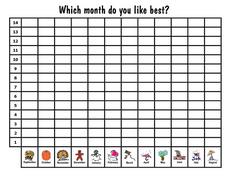
Which Month Do You Like the Best?: Graph
In this favorite month graph, students will ask their classmates which month is their favorite and record the responses to complete the bar graph.
Curated OER
What is Your Favorite Number?: Graph
In this favorite number graph worksheet, students will ask their classmates which number they like the best and record responses to complete the bar graph. Students can choose numbers 1 to 9.
Curated OER
What Sport Do You Like To Play the Most?== Class Bar Graph
In this math worksheet, students participate in making a group bar graph about their favorite sports. Students are surveyed and the responses plotted on a graph.
Curated OER
M&M's Candies Worksheet Graph
In this graphing worksheet young scholars will record data on a bar graph. Students will take a bag of M&M's and chart the colors they find inside this bag.
Curated OER
Charting and Graphing Sales
Students analyze and represent weekly sales figures using tables, bar graphs, and pie charts. They draw conclusions using bar graphs and pie charts. Students are told that each day at school they have the option of buying or bringing a...
Curated OER
Review of the Scientific Method
Learners review the Scientific Method with a hands-on activity. Working with a partner, they hypothesize the number of water drops that fit on the heads side of a penny. They collect data and share their results with the remainder of...
Curated OER
Graphing in an Experimental Context
Seventh graders discuss the importance of being able to represent scientific data in the form of graphs. They comprehend the differences between a bar graph and a line graph. Students identify the type of data with which each graph...
Curated OER
Money Circulation: A Story of Trade and Commerce
Middle schoolers are introduced to the meaning, symbolism, and value of the quarter. They determine the percentage of total monetary value held in quarters and graph the results. Students infer about the U.S. Mint's distrubution of...
Curated OER
Color Tile Graphing
Students explore data. They gather data and generate questions about the data in pictographs, tallies, tables, and bar graphs. Students use color tiles pulled by random to create their own bar graph. They discuss the bar graphs they...
Curated OER
Australian Settlers
Students interpret graphs and research events to identify links between events in the world and the arrival and plight of immigrant groups. They discuss the myths about immigration.
Curated OER
Histograms and Bar Graphs
Students are introduced to histograms, bar graphs, and the concept of class interval. They use an activity and three discussions with supplemental exercises to help students explore how data can be graphically represented (and...
Curated OER
What's the Weather?
Second graders make daily weather observations, record them with appropriate stickers on a chart, and then summarize them at the end of the week in the form of a bar graph.
Curated OER
BUS: Farming: It's A Fact (Ag)
Students create two different types of graphs from the information in the "Farm Facts" booklet (i.e., bar graph, pie chart, etc.). They calculate where your food dollars are spent (on and off farm).
Curated OER
Bar Graphs and Pie Charts
Fourth graders explore their interest and strengths and display them using a bar graph and pie chart.
Curated OER
Dealing With Data
Students collect, organize, and display data using a bar graph, line graph, pie graph, or picture graph. They write a summary describing the data represented and compare the graph to another graph in the class.
Curated OER
Dynamite Data
Second graders rotate through a variety of stations designed to offer practice in manipulating data. They sort, tally and count items and then create bar graphs, tables, and pie graphs to record their findings.
Curated OER
Which Graph is best?
Students use commercial software to organize and visually display data to draw conclusions; students use graphing software to create several types of graphs illustrating the number of each color of M&M's in one bag.
Curated OER
Graphs: Favorite Pet Graph
For this graphing worksheet, students use the data from a tally chart to create a bar graph. The graph template is provided, and students fill in the bars.
Curated OER
Jim, Tony, and Frank - The School Fundraiser
In this bar graph worksheet, students use the horizontal bar graph to count how much money each student collected for their fundraiser. Students answer 10 questions.
Curated OER
Use a Graph Reteach 4.8
For this graph worksheet, students solve 3 problems using a data table and bar graph. Students write number sentences to figure out answers to the questions about kinds of toys in a shop.


