Curated OER
M&M Graphing and Probability
Students create a variety of graphs. They count, sort, and classify M&M's by color and record data on a chart. They use data from the chart to create pictographs, bar graphs and circle graphs. They analyze data and determine...
Curated OER
Usage and Interpretation of Graphs
Young scholars review graphing and use processing skills to solve problems.
Shodor Education Foundation
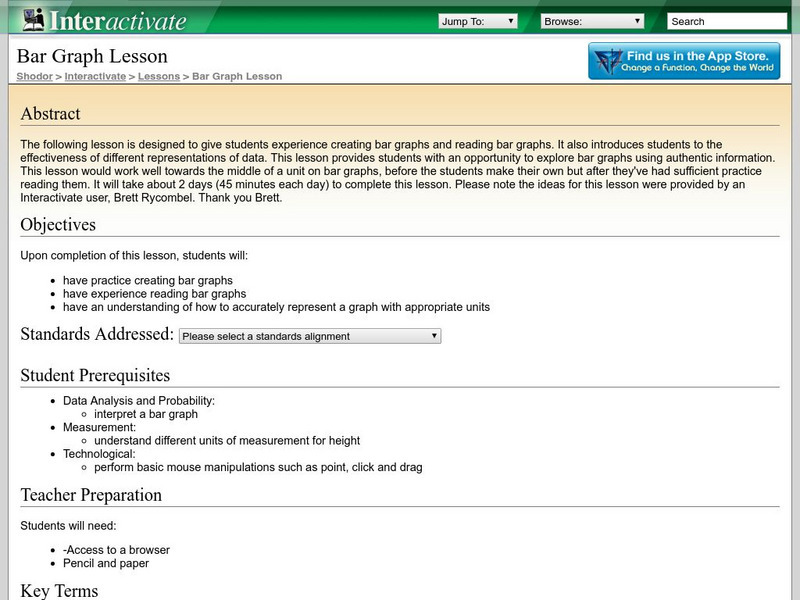
Shodor Interactivate: Lesson: Bar Graph
This lesson is designed to give students practice creating and reading bar graphs as well as understanding how to accurately represent a graph with appropriate units.
Shodor Education Foundation
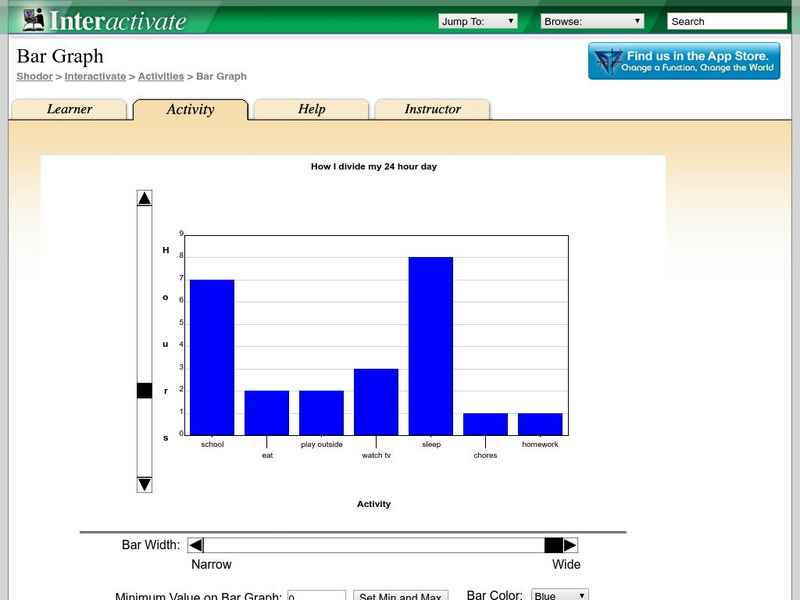
Shodor Interactivate: Bar Graph
A wonderful tool and learning experience using a bar grapher. This site contains an interactive bar grapher and much more! Follow the "What?" link to get to classroom resources such as problems and explorations.
Shodor Education Foundation
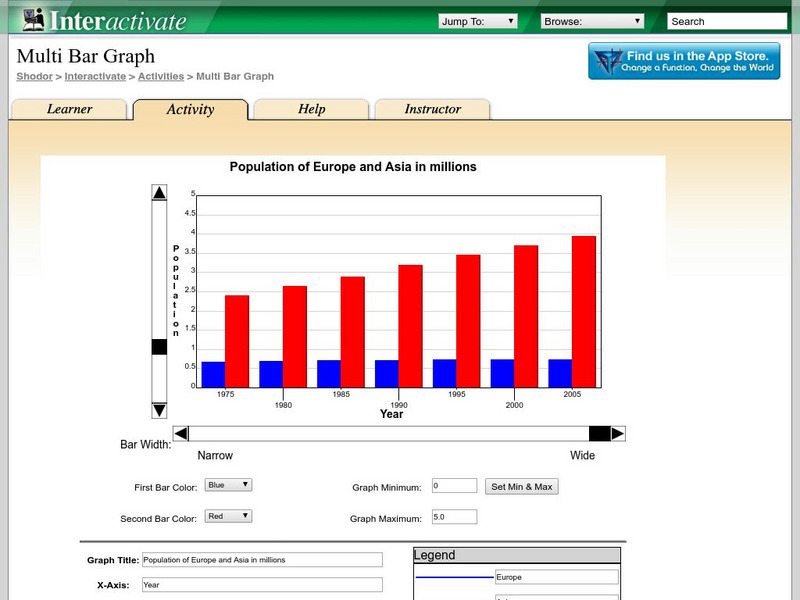
Shodor Interactivate: Multi Bar Graph
The interactive learning activity allows students to manipulate a double bar graph. Teacher resources are included.
Science Buddies
Science Buddies: Interpreting Area Data From Maps vs. Graphs
Graphical methods of data presentation are a key feature of scientific communication. This project asks the question, "What's the best way to compare the land area of states: a map or a bar graph?" You'll be measuring performance on two...
University of Texas
Inside Mathematics: Our Pets [Pdf]
This task challenges a student to demonstrate understanding of concepts involved in representing and interpreting data.
University of Texas
Inside Mathematics: Parking Cars [Pdf]
This task challenges a student to use their understanding of scale to read and interpret data in a bar graph.
McGraw Hill
Glencoe: Self Check Quizzes 2 Using Bar Graphs and Histograms
Use Glencoe's Math Course 2 randomly generated self-checking quiz to test your knowledge of Bar Graphs and Histograms. Each question has a "Hint" link to help. Choose the correct answer for each problem. At the bottom of the page click...
McGraw Hill
Glencoe: Self Check Quizzes 1 Using Bar and Line Graphs
Use Glencoe's randomly generated self-checking quiz to test your knowledge of using bar and line graphs. Each question has a "Hint" link to help. Choose the correct answer for each problem. At the bottom of the page click the "Check It"...
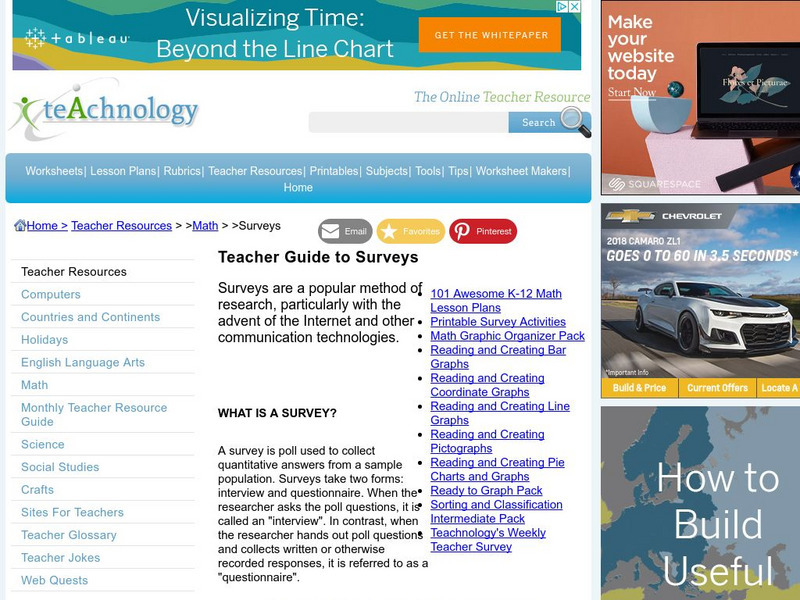
Teachnology
Teachnology: Survey Teaching Theme
Survey Theme provides an excellent collection of free sample worksheets, teacher resources, lesson plans and interactive media for grades k-12.
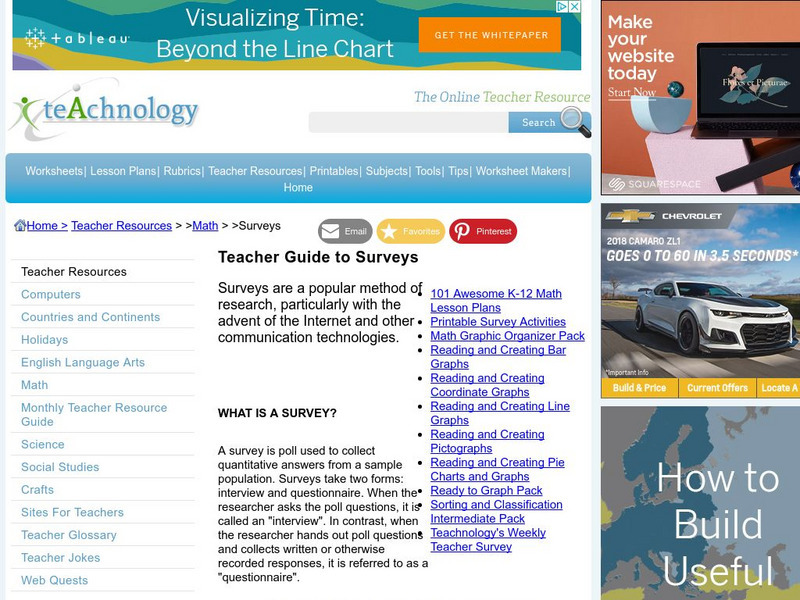
Teachnology
Teachnology: Survey Teaching Theme
Survey Theme provides an excellent collection of free sample worksheets, teacher resources, lesson plans and interactive media for grades k-12.
McGraw Hill
Glencoe: Self Check Quizzes 1 Analyzing Graphs
Use Glencoe's randomly generated self-checking quiz to test your knowledge of how to analyze graphs. Each question has a "Hint" link to help. Choose the correct answer for each problem. At the bottom of the page click the "Check It"...
US Department of Education
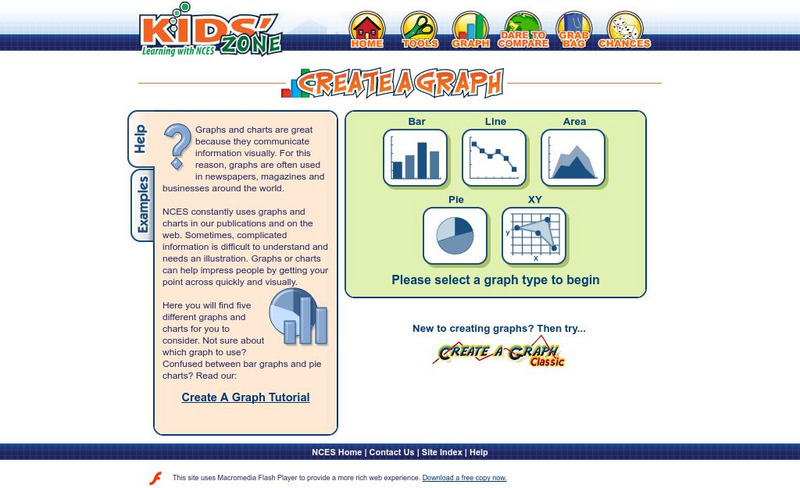
Nces Kids' Zone: Create a Graph
Resource from the National Center for Education Statistics allows you to create great bar graphs. Simply enter your information, choose appropriate colors, and voila!- you have a beautiful graph you can turn put into your report!
Other
Online Statistics Education: Graphing Distributions [Pdf]
This is the second chapter of a statistics e-text developed collaboratively by Rice University, University of Houston Clear Lake, and Tufts University. It looks at many different types of data displays and the advantages and...
US Department of Education
National Center for Education Statistics: Create a Graph Tutorial
This tutorial walks students through how to create different types of graphs using the Create a Graph tool available on the website. Covers bar graphs, line graphs, pie charts, area graphs, scatter plots, and dependent and independent...
Government of Alberta
Learn Alberta: Math Interactives: Exploring Election Data
Using actual Alberta provincial election results, students have the opportunity to interpret election data using a variety of graph types. Pictographs, line graphs, bar graphs, circle graphs, and data tables are covered in this...
Government of Alberta
Learn Alberta: Math Interactives: Exploring Data Display and Graphs
This multimedia Learn Alberta math resource focuses on graphing data. In the video portion, students will see how math is involved in the display of merchandise in stores. The accompanying interactive component provides an exploration...
Alabama Learning Exchange
Alex: Great Golly Graphs
This lesson plan asks learners to create a survey project including graphs, questions, tables, and data analysis. It gives an assessment and ideas for remediation and extension as well as ways to manage behavior problems and reluctant...
Cuemath
Cuemath: Bar Graphs
A comprehensive guide for learning all about bar graphs with definitions, solved examples, and practice questions.
Cuemath
Cuemath: What Is Bar Graph?
A comprehensive guide for learning all about bar graphs with definitions, how to use a bar graph maker, simulations, and practice questions.
PBS
Pbs Learning Media: Curious George Stem: Graphing Lesson Plan
A hands-on lesson plan where students compare and analyze data from their graphs.
E-learning for Kids
E Learning for Kids: Math: Elephant Plant: Data
Gyan's family grows flowers. Can you help him interpret displayed data about their plants?
E-learning for Kids
E Learning for Kids: Music: Presenting Data
Can you help Grace organize a dance show for her school?


![Inside Mathematics: Our Pets [Pdf] Lesson Plan Inside Mathematics: Our Pets [Pdf] Lesson Plan](https://d15y2dacu3jp90.cloudfront.net/images/attachment_defaults/resource/large/FPO-knovation.png)


