University of Regina (Canada)
University of Regina: Math Central: Circle and Bar Graphs
Students evaluate data, use the data to make different types of graphs, and then investigate these graphs. Teacher's notes are included along with downloadable versions of the activity. This lesson is from a group of lessons that uses...
US Department of Education
Nces: Create a Graph: Kids Zone
Make your own pie, bar, line, area or XY graph with this interactive tool. Look for examples of graphs already created from data collected by the National Center for Education Statistics. Complete with a graphing tutorial.
Shodor Education Foundation
Shodor Interactivate: Bar Graph Sorter
An applet allows students to sort shapes into a bar graph by color and shape. The learning resource consists of the activity, instructions, instructor notes, and additional resources.
Texas Instruments
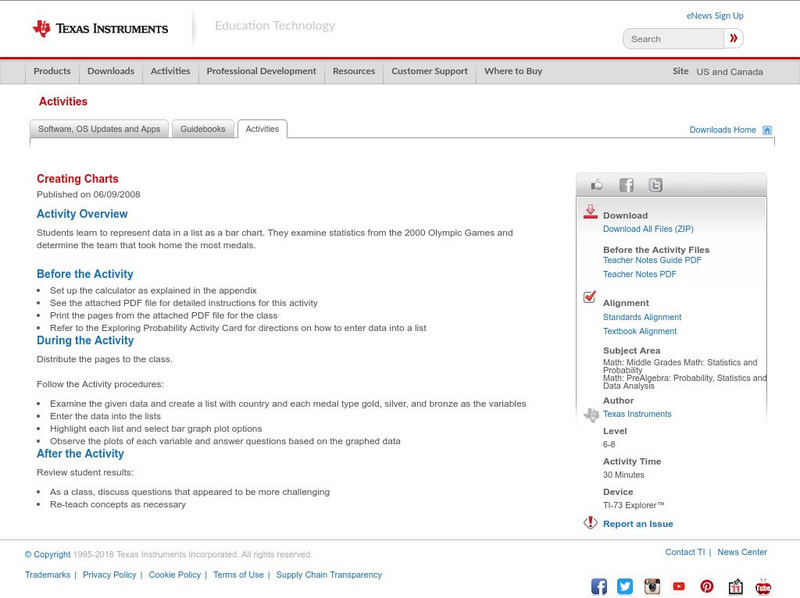
Texas Instruments: Creating Charts
Students learn to represent data in a list as a bar chart. They examine statistics from the 2000 Olympic Games and determine the team that took home the most medals.
Texas Instruments
Texas Instruments: Math Today World Population in 2050
The data in the USA TODAY Snapshot "World Population in 2050" is in a relative frequency form. students can use the percents to calculate the population for each of the continents shown and then display this data as a bar graph.
Texas Instruments
Texas Instruments: Quick Stats With Quick Poll
It's so simple. Since Quick Poll gives a bar graph when a poll is taken, the teacher can use these graphs to do all kinds of neat statistical manipulations with the students.
Texas Instruments
Texas Instruments: Gemini Candy
In this activity, students work in groups to collect data and draw conclusions from random samples simulated by drawing tiles from a bag. They represent the data collected in the form of a triple bar graph.
Primary Resources
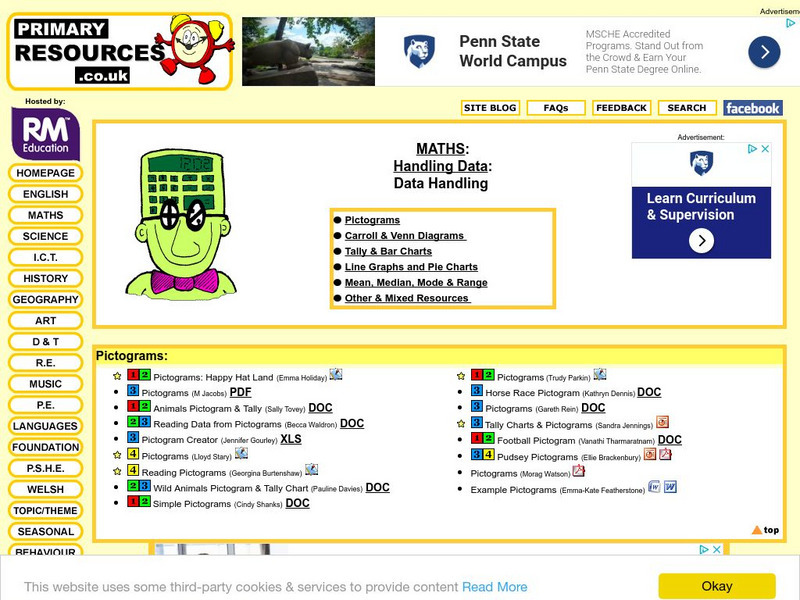
Primary Resources: Tally and Bar Charts
Lots of good materials for teaching about tally marks and bar graphs.
Texas A&M University
Wtamu Virtual Math Lab: Beginning Algebra: Reading Graphs
A good introduction to reading bar, line, and double line graphs, and drawing and reading Venn diagrams. Contains definitions and examples of these types of charts and graphs as well as practice exercises that ask you to answer questions...
SMART Technologies
Smart: Bar Graphs
This smart note book explains reading bar graphs, the parts of a bar graph, the steps to produce a bar graph and allows classes to input data a produce some bar graphs.
University of Texas at Austin
Mathematics Teks Toolkit: And We Go Around
Collect and display data using a bar and circle graph to explore fractions and percents.
Beacon Learning Center
Beacon Learning Center: Kinds of Graphs
An interactive web lesson introduces five types of graphs to students and allows them to practice matching the names to examples.
Beacon Learning Center
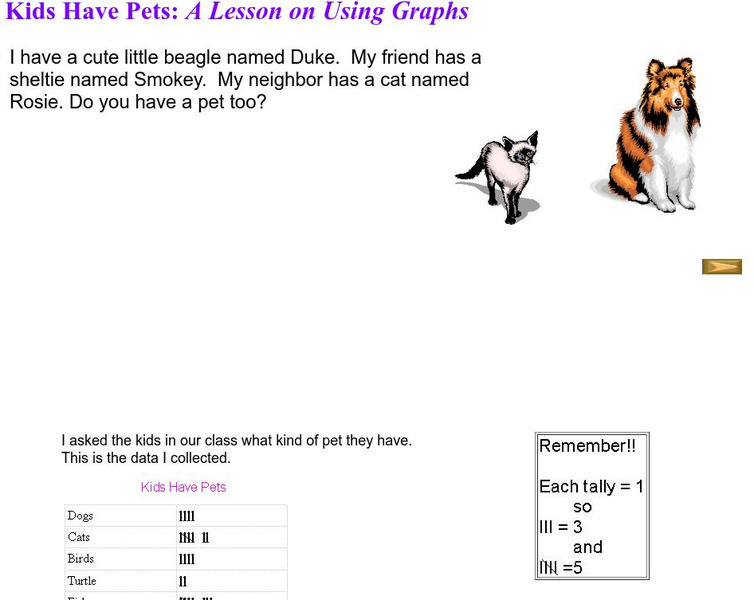
Beacon Learning Center: Kids Have Pets
The activity investigates bar graphs. Students complete a lesson using graphs to examine pets.
Beacon Learning Center
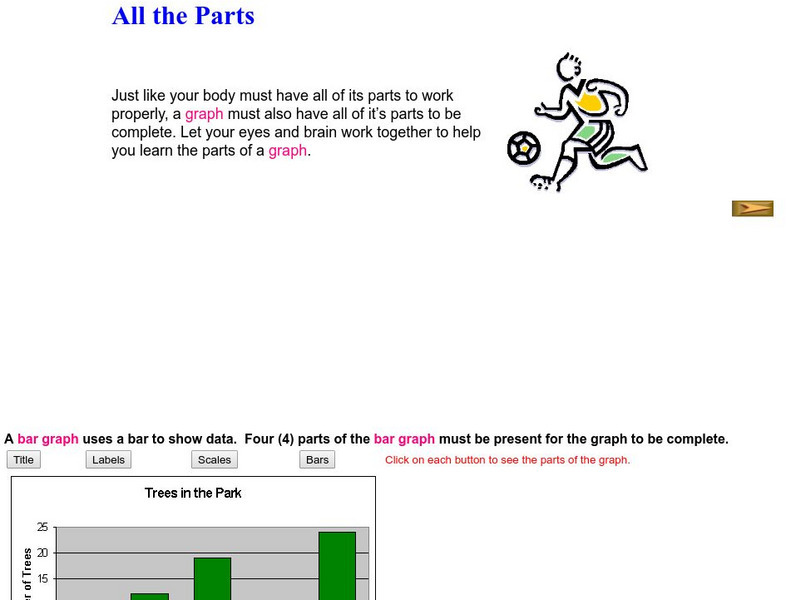
Beacon Learning Center: All the Parts
The activity investigates bar graphs. Students learn about all the parts of a graph.
Beacon Learning Center
Beacon Learning Center: How It All Stacks Up
The resource examines how to use bar graphs to organize and display data.
The Math League
The Math League: Ratio and Proportion
This tutorial provides definitions and examples of ratios and proportions and features comparing ratios and converting rates.
Beacon Learning Center
Beacon Learning Center: All That Data 2
Students describe graphs and explore range, measures of central tendency, and distribution in this interactive web lesson.
Beacon Learning Center
Beacon Learning Center: All That Data
Students analyze data by finding the mean, median, mode, and range of a set of numbers. Line plots, bar graphs, and circle graphs are also included in this lesson.
Math Is Fun
Math Is Fun: Histograms
Explains, with examples, what a histogram is, how it differs from a bar graph, and how to interpret one. Includes a set of practice questions.
PBS
Pbs: Mathline Creature Feature Lesson Plan [Pdf]
An interdisciplinary math, science, and language arts lesson that engages students in an exploration of statistics. Through a study of various forest climates, students utilize data collection and analysis, classification, and graphing....
PBS
Pbs Lesson Plan: Chances Are Talking Probability (Pdf) [Pdf]
An introductory lesson in probability for students in grades three to five. The concepts presented in this lesson are interwoven, over time, into a current unit of study. Students examine closely the "language" of probability as used in...
PBS
Pbs Mathline: Sand Babies (Pdf) [Pdf]
In this engaging activity, students use a variety of measurement strategies in creating their own Sand Babies. Students explore standard and non-standard measurements, area, data collection and analysis, and graphing. Adaptations are...
The Franklin Institute
Frankin Institute Online: Group Graphing
This site from The Franklin Institute explores how to make a simple graph using a spreadsheet to portray survey data. It also gives a set of interesting sports-related web sites so that students can get statistical inforamtion.
ABCya
Ab Cya: Fuzz Bugs Graphing
Students drag the fuzz bugs into the correct container to create a bar graph that is used to compare data.


