Illustrative Mathematics
Illustrative Mathematics: Favorite Ice Cream Flavor
The purpose of this task is for students to represent and interpret categorical data. As a class, students will answer a question with three possible answers and construct a bar graph with the responses. Multiple discussion questions and...
Illustrative Mathematics
Illustrative Mathematics: 8.sp.4 Music and Sports
This task looks at a possible relationship between playing a sport and playing a musical instrument. Students collect data from classmates, summarize the data into a two-way table, make some observations, and construct a bar graph of the...
Khan Academy
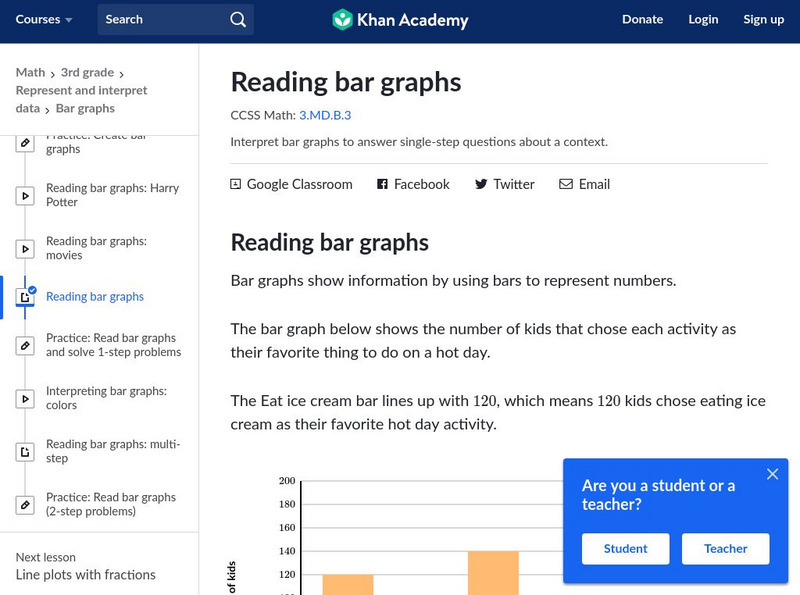
Khan Academy: Reading Bar Graphs
Explains what bar graphs are, their uses, and presents practice problems for creating a bar graph and answering questions about them. Problems are accompanied by detailed solutions.
ArtsNow
Arts Now Learning: We Are Living Graphs and Data [Pdf]
In this lesson, 3rd graders use their own bodies to create bar graphs and do problems involving addition, subtraction, and more or less amounts. They then create their own graphs, incorporating the features of graphs that they have...
CK-12 Foundation
Ck 12: Physical Science: Scientific Graphing
[Free Registration/Login may be required to access all resource tools.] Usefulness and types of graphs.
Rice University
Rice University: Cynthia Lanius: Let's Graph
An introduction to bar graphs, both vertical and horizontal in nature. The interactive aspect of this site allows students to change the values of the data - their favorite cafeteria foods - and then see how the graph is changed.
US Department of Education
Nces's Create a Graph: Bar Graph
This site from the National Center for Education Statistics allows you to create great bar graphs! Simply enter your information, choose appropriate colors, and voila! -- you have a beautiful graph you can turn put into your report!
Discovery Education
Discovery Education: Science Fair Central: Investigation Set Up and Collect Data
A brief overview of how to gather both quantitative and qualitative data, complete with a sample data table.
Alabama Learning Exchange
Alex: Get on Your Mark, Get Set, Go!
In collaborative/cooperative groups, students will review basic vocabulary and concepts for data and statistics. Students will create, collect, display, and interpret data in the form of frequency tables, bar graphs and circle graphs.
Alabama Learning Exchange
Alex: "Bursting With Math"
Using "Starburst" jelly beans to sort, graph and add.
Alabama Learning Exchange
Alex: Getting to Know Your Classmates Using Bar Graphs
Students will collect data from class using surveys. Students survey classmates concerning favorite movies, favorite color, shoe size, time spent studying, brand of cell phone and etc. From the data they will create bar graphs using an...
Alabama Learning Exchange
Alex: You Scream, I Scream, We All Scream for Ice Cream !
Fun and yummy lesson to do on a sunny spring afternoon. Have the students take a poll of their favorite choice of ice cream and create a bar graph showing the information. This lesson plan was created as a result of the Girls Engaged in...
Alabama Learning Exchange
Alex: Ice Cream Sundae Survey
Students quickly realize the importance of learning how to read and find information in charts, graphs, and tables compared to finding the same information written in a paragraph. This is a fun, high energy lesson!This lesson plan was...
Alabama Learning Exchange
Alex: What's in a Name: Graphing Lesson
A lesson that teaches students how to create and analyze a graph using the letters of their name. The lesson uses the book Chrysanthemum by Kevin Henkes (not included in the lesson plan) to start the discussion.
Alabama Learning Exchange
Alex: We're in a Pickle
A hands-on instructional activity in which children work together to discover adjectives, write a descriptive paragraph, and apply math principles to produce a bar graph interpreting results from the instructional activity.
Better Lesson
Better Lesson: Foods Third Graders Like
Third graders gather simple data, represent it on a bar graph, and answer simple, complex, and open-ended questions about the data.
Better Lesson
Better Lesson: Graphing Meaningful Data
Students use their timed test scores to create a bar graph that compares their progress in learning math facts.
Better Lesson
Better Lesson: Bar Graph Activity
The students will be collecting data from other students to represent in a bar graph. If available, they can then use a computer program called Bar Grapher tool to show their data with a different layout.
Better Lesson
Better Lesson: Say It With Stats! Review
The students will be working in centers to review for their test. The centers will consist of a computer rotation, versa-tiles, and a teacher center. All centers will reinforce concepts learned throughout this unit to prepare them for...
Better Lesson
Better Lesson: What's in Your Name?
The students will be collecting data from other students to represent in a bar graph.
Better Lesson
Better Lesson: Bar None. Analyzing and Creating Bar Graphs
The students will love this real life learning. They will be able to get information from a graph as well as create their own graphs from the questions they have developed.
Khan Academy
Khan Academy: Bar Graphs Review
Bar graphs are a nice way to visualize categorical data. This article reviews how to create and read bar graphs.
Better Lesson
Better Lesson: Snack Attack
Graphing can be made fun and hands-on with different real world "tools" - like snacks!
Better Lesson
Better Lesson: Building Our Own Bar Graphs (Part I)
Second graders use data to create a tally chart and make a bar graph. This instructional activity includes a detailed plan, videos of students engaged in the instructional activity, and printable worksheets.


![Arts Now Learning: We Are Living Graphs and Data [Pdf] Lesson Plan Arts Now Learning: We Are Living Graphs and Data [Pdf] Lesson Plan](https://d15y2dacu3jp90.cloudfront.net/images/attachment_defaults/resource/large/FPO-knovation.png)


