University of St. Andrews (UK)
University of St. Andrews: History of Mathematics: Abraham De Moivre
This site contains biographical information and works of the mathematician Abraham DeMoivre.
University of St. Andrews (UK)
University of St. Andrews: Ludwig Boltzmann (1844 1906)
A very in-depth biography of this wonderful individual who had numerous successes, Maxwell-Boltzmann Distribution Curves included.
Other
Correlation Coefficients
This page provides a good discussion of correlation coefficients (r,) which indicate the "strength of the linear association between variables." Includes formulas and scatter plots. Some prior knowledge of statistics might be helpful.
Varsity Tutors
Varsity Tutors: Hotmath: Practice Problems: Tables and Graphs
Six problems present various aspects of using and making tables and graphs to display statistics. They are given with each step to the solution cleverly revealed one at a time. You can work each step of the problem then click the "View...
Mangahigh
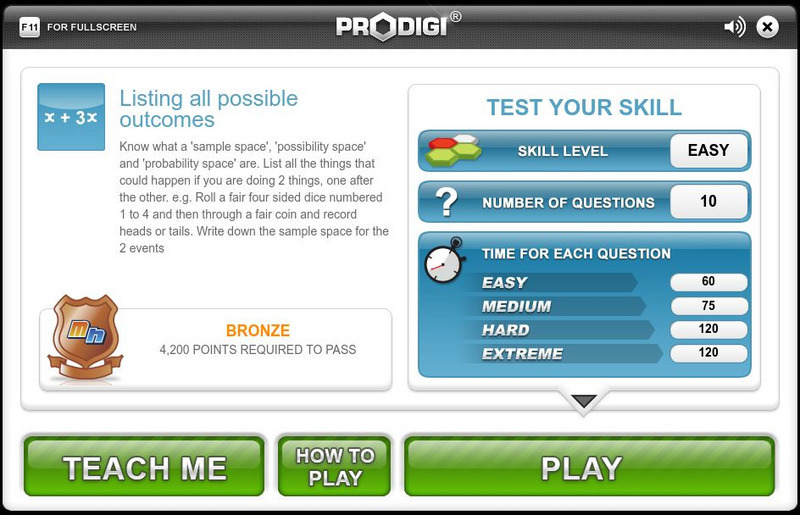
Mangahigh: Data: Listing All Possible Outcomes
Students learn about the concept of possible outcomes by exploring a tutorial. They can then test their knowledge by taking a ten question assessment that increases in difficulty as they correctly answer questions.
Richland Community College
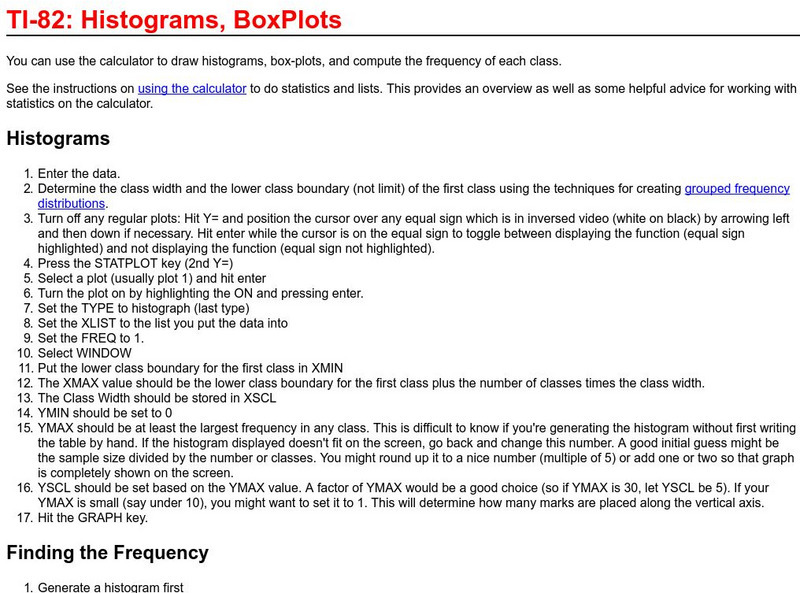
Richland College: Ti 82 Histograms / Box Plots
Richland College provides a step-by-step procedure on how to use a TI-82 to construct histograms and box plots and then use this to find frequency distribution.
ClassFlow
Class Flow: Donkey Derby Handling Data
[Free Registration/Login Required] Can you list all probabilities when two dice are thrown? Run your own race here and see which donkey wins.
That Quiz
That Quiz: Probabilidad
Test your knowledge of probability by taking this practice test. Five levels are provided and it also tracks the number of correct and wrong answers.
Sophia Learning
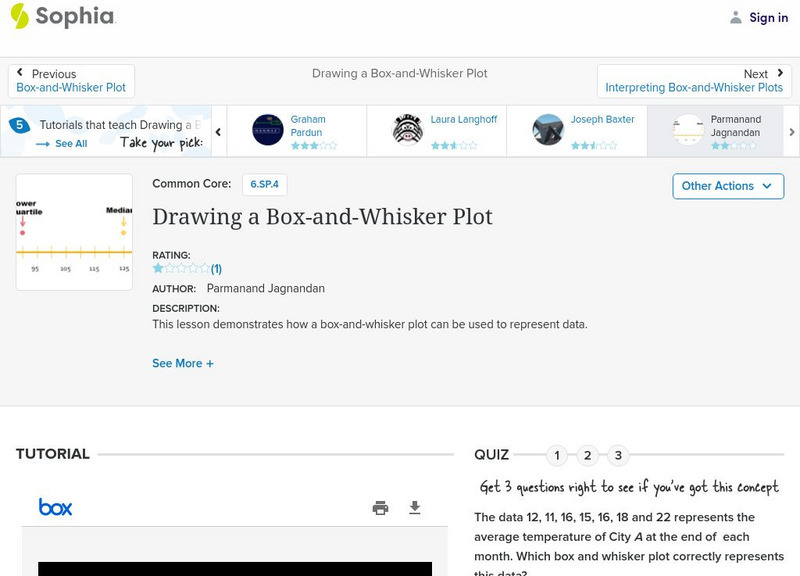
Sophia: Drawing a Box and Whisker Plot
This lesson demonstrates how a box-and-whisker plot can be used to represent data.
Sophia Learning
Sophia: Representing Data With Box and Whisker Plots
This lesson demonstrates how a box-and-whisker plot can be used to represent data.
Sophia Learning
Sophia: Representing With Box and Whisker Plots: Lesson 1
This lesson demonstrates how a box-and-whisker plot can be used to represent data. It is 1 of 3 in the series titled "Representing with Box-and-Whisker Plots."
Other
Eduteka: Matematica Interactiva
Topics covered in this site are: concepts of numbers, geometry, algebra and statistics. This site has lesson plans, interactive activities and discussions.
Khan Academy
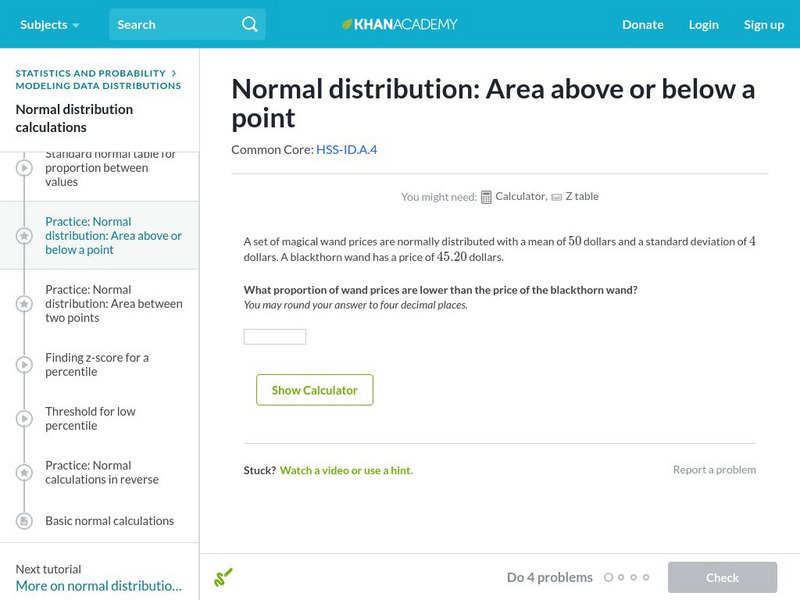
Khan Academy: Normal Distribution: Area Above or Below a Point
Use a z-table to find the probability of a particular measurement. Students receive immediate feedback and have the opportunity to try questions repeatedly, watch a video or receive hints.
CK-12 Foundation
Ck 12: Mutually Inclusive and Mutually Exclusive Events
[Free Registration/Login may be required to access all resource tools.] Learn about mutually inclusive and exclusive events in probability.
Khan Academy
Khan Academy: Normal Distributions Review
Normal distributions come up time and time again in statistics. A normal distribution has some interesting properties: it has a bell shape, the mean and median are equal, and 68% of the data falls within 1 standard deviation.
Khan Academy
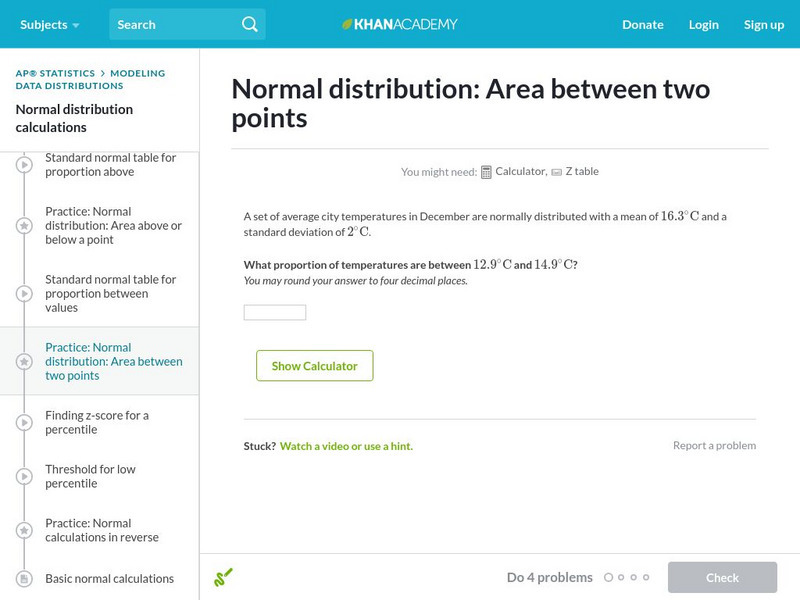
Khan Academy: Normal Distribution: Area Between Two Points
Use a z-table to find the probability that a particular measurement is in a range. Students receive immediate feedback and have the opportunity to try questions repeatedly, watch a video or receive hints.
Other
Utah St. Univ.: Coin Tossing Applet
An interesting Applet that simulates the toss of a coin 100 times. A quick count of the results and an accompanying graph make this site useful for both teacher and student.
Other
Northern Michigan University: Stem and Leaf Plot
Site discusses how to use stem-and-leaf plots with an example and the steps listed for easy reading.
Annenberg Foundation
Annenberg Learner: Sampling the Electorate
As the pollster for candidate Higgins, you need to know how she is faring with different groups. Read her political profile, view the demographic profile of the city, decide on the groups to poll, review the results and learn about...
Khan Academy
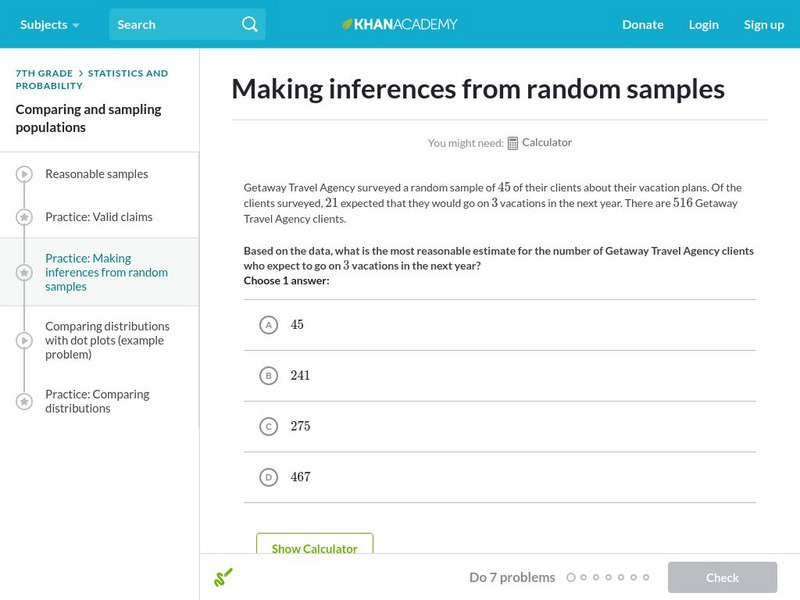
Khan Academy: Making Inferences From Random Samples
Practice making inferences from random samples.
Khan Academy
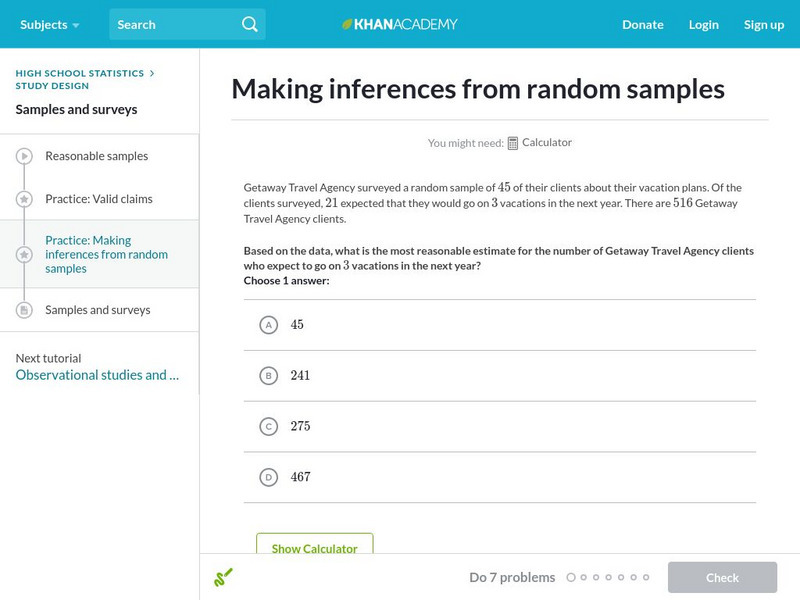
Khan Academy: Making Inferences From Random Samples
Given a random sample, practice figuring out what can we reasonably infer about the entire population? Students receive immediate feedback and have the opportunity to try questions repeatedly, watch a video or receive hints.
Duke University
Duke University: Web Feats Ii: Lessons on Regression at Hessian
This site has several lessons on regression, "Designed to help students visualize topics associated with lines of regression, given a set of data points." Go to the teacher notes to find the objectives and standards which apply.
Wolfram Research
Wolfram Math World: World's Most Extensive Mathematics Resource
MathWorld provides a huge mathematics encyclopedia detailing the concepts of geometry, algebra, calculus, discrete math, number theory, and other math topics--complete with formulas, diagrams, examples, and references for thorough...
National Council of Teachers of Mathematics
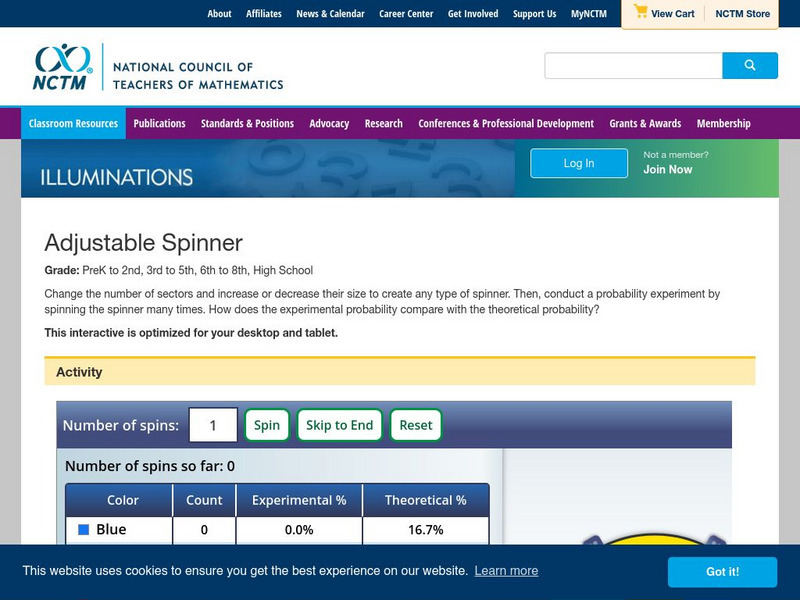
Nctm: Illuminations: Adjustable Spinner
An adjustable spinner to provide random spins of a computer based spinner for any mathematical experiment requiring random spins.


