CK-12 Foundation
Absolute Value Inequalities: The Nuts and Bolts of Allowable Error
Explore the nuts and bolts of absolute value inequalities using nuts and bolts. Pupils use an interactive to see how the minimum and maximum radii of a nut-and-bolt combination change based on the target radius and the allowable error....
CK-12 Foundation
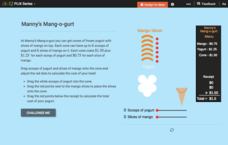
Functions that Describe Situations: Manny's Mang-o-gurt
How much does it cost to add more mangos? An interactive allows users to see how the price of frozen yogurt changes based on the number of scoops and the number of slices of mango. Learners then answer a set of challenge questions about...
CK-12 Foundation
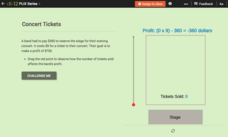
Linear Inequalities: Concert Tickets
Profit from this resource on linear inequalities. A slider interactive lets users see how the profit on band ticket sales changes with the number of tickets. A set of challenge questions provides some situations for learners to consider.
CK-12 Foundation
Solving Real-World Problems Using Multi-Step Equations: Bowling Ball Delivery
How many bowling balls can a truck carry? A slider interactive changes the weight of boxes and the number of bowling balls per box. Investigating with this slider lets users find the maximum number of bowling balls.
CK-12 Foundation
Supplementary Angles: Spiderweb Angles
The itsy, bitsy spider went up the virtual wall. An interactive allows users to change the angles in a spider web. They must attend to supplementary angles as they answer challenge questions throughout the interactive.
CK-12 Foundation
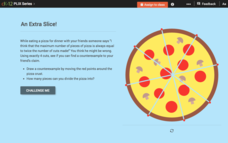
Conjectures and Counterexamples: An Extra Slice!
Class members will eat up an enticing interactive that lets users change the location of cuts made into a pizza to adjust the number of created slices. They create a counterexample for a conjecture on the number of slices.
CK-12 Foundation
When to Use the Distributive Property: Rational Expressions
Discover how the distributive property applies to division. As learners change numeric values within an expression, the simulation calculates its value. Challenge questions lead individuals to realize the power of distributing the...
CK-12 Foundation
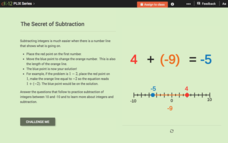
Properties of Real Number Addition: The Secret of Subtraction
Learners sometimes struggle to understand the concept of adding and subtracting integers. Help them see the why behind their answers using the interactive number line. The values change as individuals adjust the number line for each new...
CK-12 Foundation
Simplify Variable Expressions Involving Integer Addition
Ensure your classes aren't drowning in expressions. An interactive simulation has scholars change the depth of a fish based on the coefficient of terms. As they add the terms together, the fish bobs up and down until reaching the answer.
CK-12 Foundation
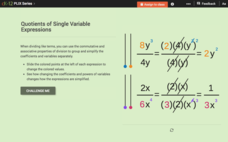
Simplify Products or Quotients of Single Variable Expressions: Quotients of Single Variable Expressions
Investigate division within an algebraic term using an inquiry-based lesson. Individuals adjust sliders and watch as the simplification of the term changes. Questions help guide them to important conclusions.
CK-12 Foundation
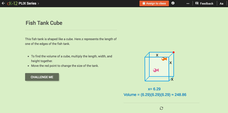
Algebra Expressions with Exponents: Fish Tank Cube
There's nothing fishy about this resource. A slider interactive lets users adjust the side length of a fish tank cube. It aids in seeing changes in the volume and how to express the volume using an algebraic expression.
CK-12 Foundation
Patterns and Expressions: Cookie Jars
It's okay to get caught with your hand in a virtual cookie jar. Pupils use an interactive to drag cookies from two cookie jars onto a plate. They investigate how an expression representing the number of remaining cookies changes as users...
CK-12 Foundation
Identify Line Types: Identify Types of Lines
If lines aren't parallel or perpendicular, then what are they? An interactive lets users rotate a line to change its orientation
with respect to another line. It then indicates whether the
lines are parallel, perpendicular, or...
CK-12 Foundation
Interpretation of Circle Graphs: Northwest Region Population Pie
Given populations of the five Northwestern states, learners create a circle graph. Using the data and the pie chart, they make comparisons between the populations of the states. Finally, the pupils determine how the chart will change...
CK-12 Foundation
Pie Charts: Soda Party
Using the interactive, pupils create a pie chart that represents the percentage of sodas bought for a party. Individuals need to determine the percentage and number for the final variety of drinks. The learners determine how the...
CK-12 Foundation
Types of Data Representation: Baby Due Date Histogram
Histograms are likely to give birth to a variety of conclusions. Given the likelihood a woman is to give birth after a certain number of weeks, pupils create a histogram. The scholars use the histogram to analyze the data and answer...


