Curated OER
Comparison of Snow Cover on Different Continents
Students use the Live Access Server (LAS) to form maps and a numerical text file of snow cover for each continent on a particular date. They analyze the data for each map and corresponding text file to determine an estimate of snow cover...
Curated OER
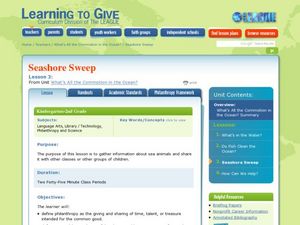
Seashore Sweep
Young scholars gather information about sea animals. For this ocean lesson, students read a story about the ocean and seashore. They discuss the needs of seashore animals and create a Mystery Ocean Animal riddle book. Young scholars...
Curated OER
Electric Field Mapping in 3D
Students create a 3D vector field map of an electric field. In this physics lesson, students measure the voltage inside an aquarium with water. They present their findings and map to class..
Curated OER
Comparison of Two Different Gender Sports Teams - Part 1 of 3 Measures of Central Tendency
Students gather and analyze data from sports teams. In this measures of central tendency lesson, students gather information from websites about sports team performance. Students analyze and draw conclusions from this data. This lesson...
Curated OER
Which Tape is Stickiest?
Students conduct an experiment to determine which style of tape will stick the best. In this controlled experiment lesson, students predict which tape will stick best to a marble that rolls over it, then they conduct the experiment and...
Curated OER
Surfing Amusement parks
Learners must surf the Internet to find out how much it cost for his or her family to go to amusement parks in California.
Curated OER
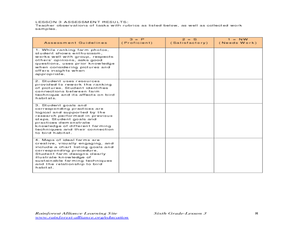
How can my breakfast help the birds?
Sixth graders design farms with a bird's habitat in mind. In this farm lesson plan, 6th graders research how sun grown coffee destroys a bird habitat, and then they make their own farm with a bird's habitat being preserved. They then...
Curated OER
"Measurement in Motion"
Ninth graders examine the rate of motion and changes in motion using a ramp and a rolling object. They conduct the demonstration, determine the average speed, and describe how a moving object can have zero acceleration and deceleration.
Curated OER
A Bird's Eye View of our 50 States
Third graders focus on state birds as they learned absolute location (latitude/longitude) of each state, as well as their relative location (bordering states).
Curated OER
How Fast Is Your Car?
Eighth graders discover the relationship between speed, distance, and time. They calculate speed and represent their data graphically. They, in groups, design a ramp for their matchbox car. The goal is to see who's ramp produces the...
Curated OER
Box-and-Whisker Plots
Eighth graders measure in feet and inches and convert to explore the relationship between the converted measurements. In this measurement lesson plan, 8th graders use the whisker and box plot to represent the measurement of a cat. ...
Curated OER
Understanding Cloud Formation
Students explore air and clouds by watching demonstration. They perform an experiment to measure air pressure changes.
Curated OER
Understanding Cloud Formation
Students read and relate the poem, "Clouds" by Aileen Fisher to a demonstration on cloud formation. They create clouds in jars using ice water and matches then discuss the ways clouds can be used to predict weather.
Curated OER
Stock Reports
Learners spend $10,000 by picking up to 3 stocks in which to invest. They monitor their progress for three weeks, and chart results in a spreadsheet template.
Curated OER
Phenomenal Weather-Related Statistics
Eighth graders research, collect and interpret data about weather statistics. They record that data on spreadsheets. they create Powerpoint presentations on their individual or group research.
Curated OER
Do You See What I See?
Students observe and describe different objects seen under a microscope and compare the individual perspectives of what was seen.
Curated OER
We Are Having a Party! Part II
Second graders, in groups, participate in a four-station rotation model to solve problems. They use coins and dice for stations one, two, and three.
Curated OER
Definition and Applications of Computational Science
Students participate in a variety of instructional experiences about Computer Science. They define Computational Science and describe computational simulation. They also compare and contrast Computational Science and Computer Science.
Curated OER
Introduction to Graphical Representation of Data Sets in Connection with Nuclear Decay
Students record data, make observations, and share in experimentation and discussion of numerical experiments.
Curated OER
Picture a Nation
Learners research immigration data from a specific time period. They create a graphic organizer that depicts the information and share the information with the class.
Other popular searches
- Line Pie Bar Graph
- Line/bar Graph
- Line and Bar Graphs
- Line Bar and Circle Graphs
- Line Graph Bar Graph
- Line, Bar, and Circle Graphs
- Line, Bar and Circle Graphs
- Double Bar Line Graphs


