Other
Hhs: Physical Activity Fundamental to Preventing Disease
Here, read statistics from the US Department of Health and Human Services concerning exercise and its key role in preventing chronic illness and premature death. Use these findings from medical studies in which diseases were studied in...
Other
The Topic: Charts and Graphs
Brief descriptions of charts and graphs, followed by links to larger sites on the same subject.
Wolfram Research
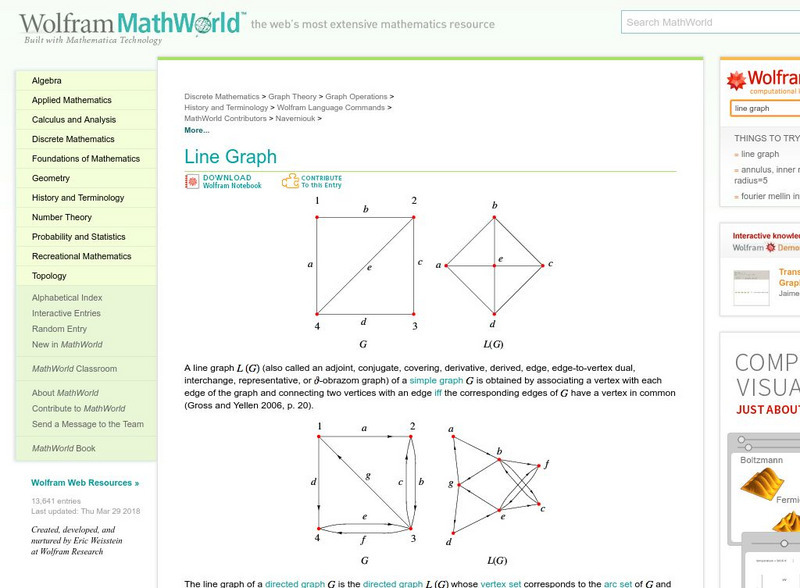
Wolfram Math World: Line Graph
Definition of a line graph with a variety of examples. Includes maps, charts, and detailed explanations for understanding.
Other
Bucks County Community College: Visual Organizers
This site walks you through the benefits of visual organizers, and focuses on a variety of types: tables, charts, graphs, timelines, flowcharts, diagrams, and webs.
ProProfs
Pro Profs Quiz Maker: Map Reading Awareness Quiz
This is a nine-question quiz about information on maps and parts of a map. The questions are timed, but not limited.
Other
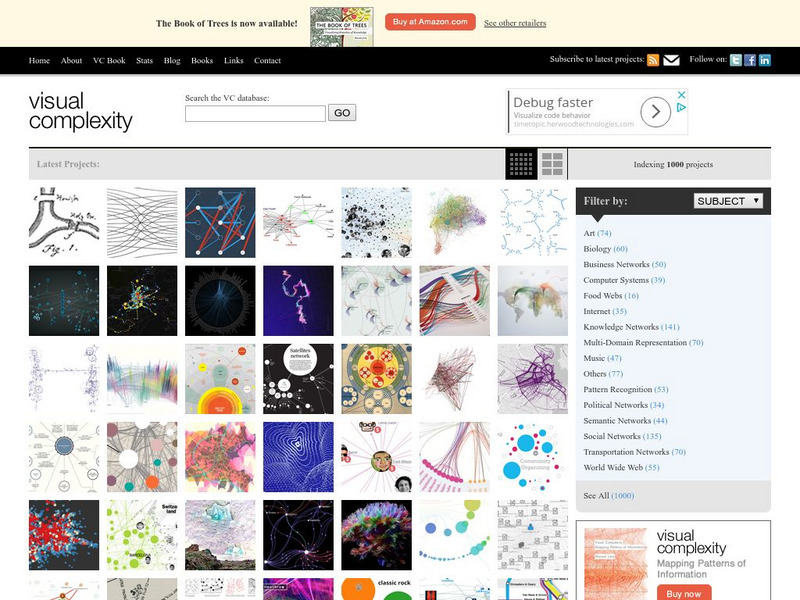
Visual Complexity: Visualizing Complex Networks
Examples of over 300 differnt types of maps, flow charts, and graphs. Emphasis is placed on the artistic and aesthetic qualities of the maps' visual components.
English Zone
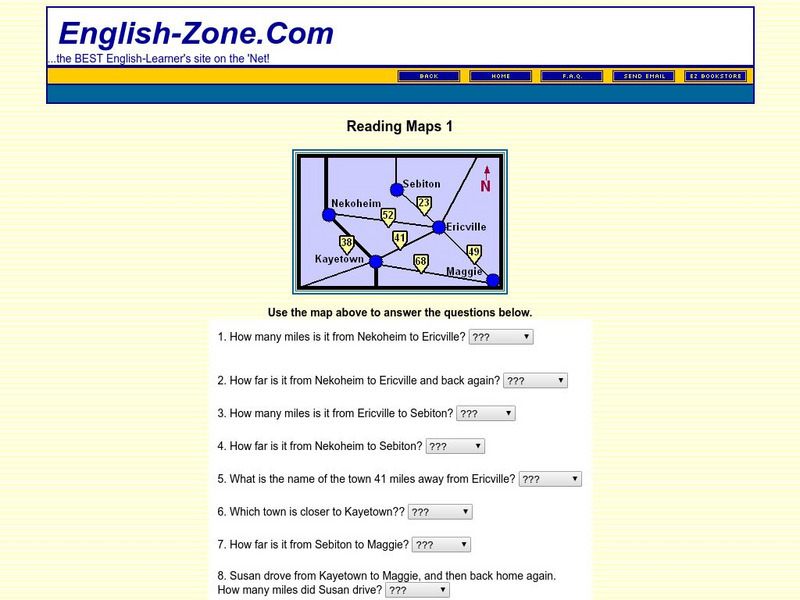
English Zone: Reading Maps 1
Using the map provided, students are to answer questions such as how far is it from one town to another.
Pew Research Center
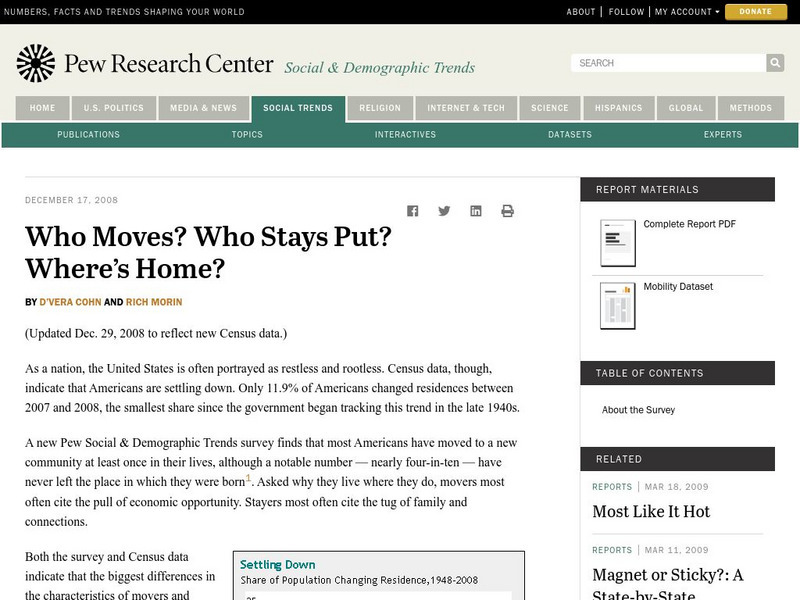
Pew Social and Demographic Trends: Migration Flows in the United States
The Pew Hispanic Research Center details the migration flows of the United States. Breaks down U.S. migration patterns from the last 20 years. Scroll mouse over map to see the regional migration throughout the years. View a map which...
US Energy Information Administration
U.s. Eia Energy Kids: Nonrenewable Energy Sources
This resource provides information about nonrenewable energy sources. There is specific information about each of these energy sources, and lots of maps, charts, tables, and graphs to further the understanding.
Texas Education Agency
Texas Gateway: Evaluate Graphics in Informational/procedural Text
You will learn how to evaluate graphics for their clarity in communicating meaning and achieving a specific purpose.
E-learning for Kids
E Learning for Kids: Math: Tea Store: Reading a Table
Students will demonstrate how to interpret information in a table.
Other
Kim's Korner: Graphic Organizers for Writing and Reading
What are graphic organizers for reading and writing? Use this site to learn more about these learning tools.
Virginia History Series
Virgina History Series: Virginia State History Post Wwii to Present Day [Pdf]
Visualize the major events in the last half of the 20th century such as major wars and civil rights issues through the lens of the state of Virginia. In addition, learn about the pop culture of this time specifically in Virginia. Enjoy...
Other
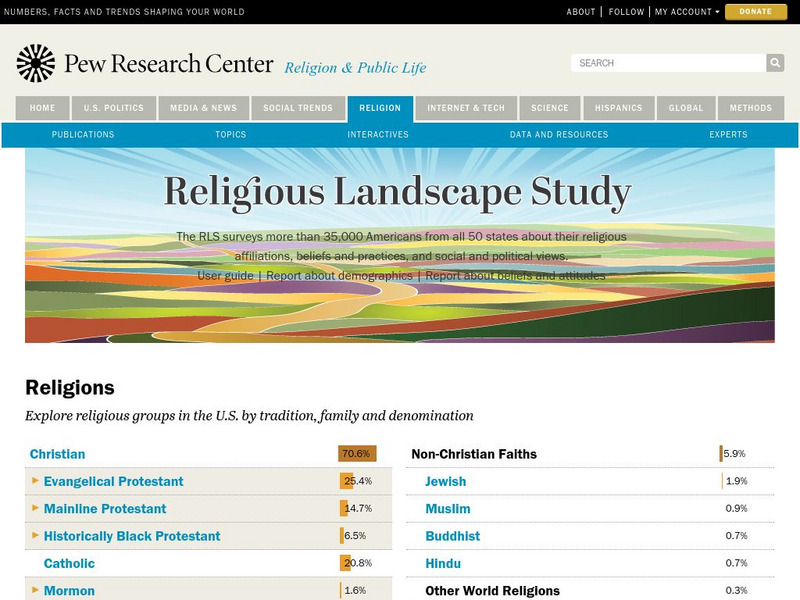
Pew Forum on Religion and Public Life: u.s. Religion Landscape Survey
Website summarizing the results of a survey on religion in the U.S. Contains maps and charts of information for each specific religion as well as bar graphs comparing the deomographics of the different religious groups. Two full reports...
City University of New York
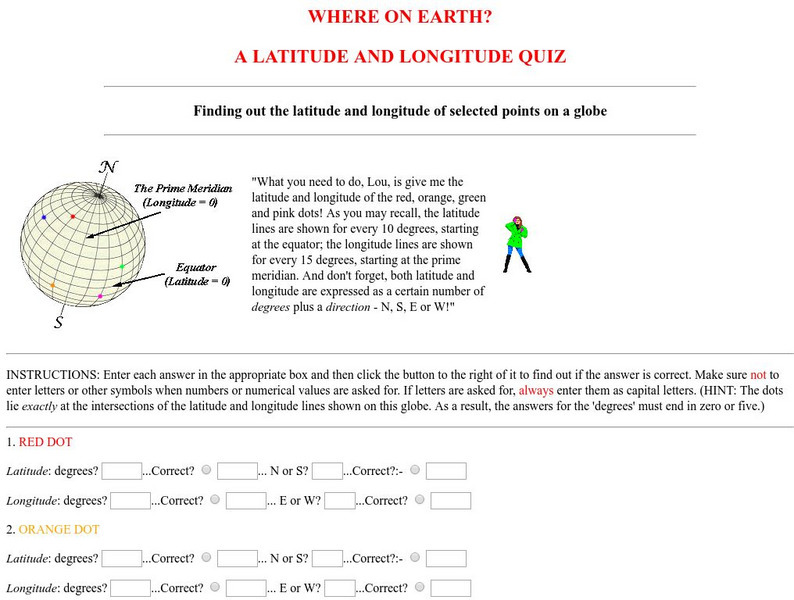
Virtual Geology: Where on Earth: A Latitude and Longitude Quiz
This quiz starts with select points on a globe. Students must determine the latitude, longitude, and direction for each point.
ReadWriteThink
Read Write Think: A Picture's Worth a Thousand Words: Image to Narrative
This lesson, which can be adapted to fit with any picture you choose, works for students of all levels.
Texas Education Agency
Texas Gateway: Synthesize Ideas in Informational/expository Text
[Accessible by TX Educators. Free Registration/Login Required] Learn how to synthesize and make logical connections between ideas within a text and across two or three texts representing similar or different genres and to support the...
NOAA
Noaa: The Great Usa Flood of 1993
Interesting abstract about the flood that hit the Midwest in 1993, one of the worst floods in United States History. Find out why the flood occurred, the damage, maps of the damage, charts, graphs, and statistics.
Florida Center for Reading Research
Florida Center for Reading Research: Exp. Text Structure: Text Feature Find
A lesson plan in which students look through a book to find various text features including: a table of contents, sequence and format, charts/graphs/maps, diagrams/graphics/illustrations, print variations, an index, and a glossary....
Sophia Learning
Sophia: Choosing Whether to Use Software or Technology to Enhance Ideas
A tutorial explaining how to use technology to create graphics and visuals to enhance documents and presentations. A brief audiovisual presentation identifies types of visuals, and another audiovisual presentation describes how and when...
Other
Graphic Greats: Photo Treatment
This resource presents an article about the use of photos in documents.
University of Texas at Austin
University of Texas: Human Environmental Interactions [Pdf]
Inspired by Hemispheres' 2004 Teachers' Summer Institute, People and Place: Human-Geographic Relations, this curriculum unit was designed to address human adaptation to and modification of the environment. How have humans adjusted to...
Other popular searches
- Maps Graphs and Charts
- Graphs, Charts and Maps
- Graphs\, Charts and Maps
- Charts, Graphs, Maps
- Maps, Charts, Graphs, Tables


