Curated OER
Creating Circles
Learners make a circle graph. In this graphing lesson, the teacher conducts a class survey, then demonstrates how to make a pie graph. When students are comfortable with the material, they use a worksheet to create their own graph.
Curated OER
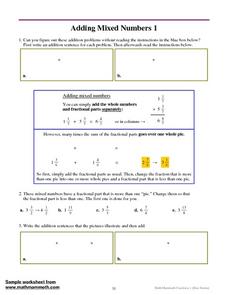
Adding Mixed Numbers 1
In this adding mixed numbers worksheet, students write addition sentences using pie charts, add mixed numbers with the same denominator, and write mixed numbers as fractions in simplest form. Students solve nine problems.
Curated OER
Sky Observation Project
In this sky observation activity, students make observations of the night sky and use their planisphere and star charts to help identify what they observe. They make observations and record what they see for 10-15 minutes. They draw a...
Curated OER
Skittle it Up
Students make a graph. In this graphing and Excel lesson, students work in groups and are given a bag of skittles. Students count the number of each color skittle and create a table in Excel. Students learn how to make a pie graph using...
Curated OER
Who Represents You?
Students investigate Congress and how individuals are represented in this Country. In this government instructional activity, students complete worksheets research government web sites to determine which senators and congressmen...
Curated OER
Put Patterns to Work for You!
For this patterns worksheet, students complete multiplication charts and division problems to solve pattern problems. Students complete 11 problems total.
Curated OER
Weather with Pink Snow and Other Weird Weather
Third graders explore different kinds of weather. For this weather lesson, 3rd graders discover the different ways humans protect themselves from weather. Students read the book Pink Snow and Other Weird Weather by Jennifer Dussling....
Curated OER
Physical Geography- Climate
Sixth graders explore different climates. In this compare and contrast lesson, 6th graders look at the differences in climates of America and Europe. Students use KWL charts and graphic organizers to record information about different...
Curated OER
The Whale Trail
Students research the Gray Whale. In this Gray Whale lesson, students use KWL charts to organize information. Students do Internet research to gain information about the whales. Students get into groups and create a mock news broadcast...
Curated OER
Weather
Learners watch a weather forecast to take careful note of the weather charts used. They make their own version of weather charts utilizing resources imbedded in this plan.
Curated OER
Jim, Tony, and Frank-The School Fund-raiser (Graphing)
In this graphing learning exercise, students view a pie chart. Students use their graphing knowledge to interpret the pie chart and answer ten questions. There is an answer sheet.
Curated OER
Multiplication Charts, Multiply By 2-10
In this multiplication chart worksheet, learners will solve multiplication problems where they complete a two column chart. On each chart one of the factors is two through 10. The other factor may be any number because it is left blank.
Curated OER
Lobster Business Charts
Young scholars research four Maine based businesses involved with lobster fishery as a career analysis. For this career exploration lesson, students research lobster fishery businesses and write a class book showing the progression of a...
Curated OER
Navajo Weaving
Learners explore the Navajo culture. In this Navajo Indians lesson, students gain information about their weaving and dancing. Learners note the patterns in the weaving. Students create a dance that corresponds with the patterns they see...
Curated OER
Data Analysis: Graphs, Charts, Tables, Statistics
In this data analysis worksheet, students interpret data in 5 problems involving graphs, tables, and scatterplots. Students construct 1 stem and leaf plot and find the mean, median, and mode of a data set.
Curated OER
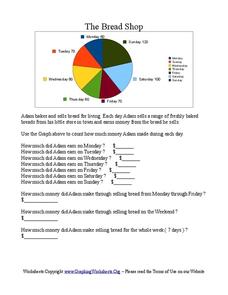
The Bread Shop
In this pie chart worksheet, learners use the pie chart graph to count the money Adam made in the Bread Shop. Students complete 10 questions.
Curated OER
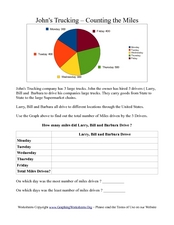
John's Trucking- Counting the Miles
In this graphs worksheet, students analyze a pie graph showing miles driven by three truck drivers in a week. Students fill out a chart in which they calculate total miles driven.
Curated OER
Hopes and Dreams: A Spreadsheet Lesson Using Excel
Fourth graders read "The Far Away Drawer" by Harriet Diller and discuss the story as a class. After discussion, 4th graders create a t-shirt GLYPH about their hopes and dreams,share their information with the class and create spreadsheets.
Curated OER
Understanding Fractions
In this recognizing fractions worksheet, students observe explanations and examples of pie charts and bars and use them to color, write the fraction of the shaded part, and draw and color pie charts. They will solve thirty-two problems.
Curated OER
Data and Probability: What is the Best Snack?
In this math/nutrition lesson, the nutritional value of 3 snack foods is recorded on a data chart and represented on a bar graph. Students analyze and compare information, construct data charts and related bar graphs, and draw...
Conneticut Department of Education
Instructional Strategies That Facilitate Learning Across Content Areas
Imagine 28 instructional strategies, appropriate for all subject areas and all grade levels. Directed Reading-Thinking Activities (DRTA), Question-Answer Relationship (QAR) activities, KWL charts, comparison matrixes, classification...
Curated OER
Variation and Heredity
Junior geneticists tally eye color and height in their lab groups. They examine certain traits in soybean and corn seedlings. For each activity, they gather data and learn about continuous and discontinuous genetic variation. In another...
Curated OER
Regents Review Worksheet #1: Principles of the U.S. Constitution
Kids who take the Regents Exam really need to know a lot of information. This is a wonderful exam review tool that includes 26 pages of questions, charts, and suggested readings to help upper graders pass the test. It focuses on all...
Curated OER
Reasons for Settling the New World
After studying the reasons settlers entered the New World, primary learners try to persuade others to enter this new land. Class members present their arguments in a variety of ways including posters, writings, and charts. Richly...
Other popular searches
- Charts and Graphs
- Multiplication Charts
- Maps and Charts
- Tally Charts
- Pie Charts and Graphs
- Pie Chart
- Multiplication Charts to 100
- Reading Charts and Graphs
- Behavior Charts and Graphs
- Charts and Graphs Candy
- Interpret Charts and Graphs
- Charts and Graphs Christmas


