Curated OER
Unit 6b -Year 5
If you have some 9-10 year olds who are ready for some 5th year math, then check out this UK math unit. There are 172 slides that cover all of the basic multiplication tables, relate those to division, fractions, sequencing, and an...
Curated OER
Weather Instrument Data Chart 2
In this science worksheet, students look for the data that is needed to fill in the graphic organizer. The prefixes are given that are needed to sort the information as it is collected.
Curated OER
Place Value Charts to the Millions Place
In this math worksheet, students learn to read, write, order and compare numbers and place them on a place value chart. Students begin the 4 pages of exercises by studying a sample place value chart. Students then fill out 3 other charts...
Curated OER
Five Minute Frenzy Charts (D)
In this multiplication facts worksheet, students complete four 10 by 10 grid charts with multiplication facts to 144. Students try to complete each chart in less than five minutes and score 98% or better.
Curated OER
Five Minute Frenzy Charts (E)
For this multiplication facts worksheet, students complete four 10 by 10 grid charts with multiplication facts to 144. Students try to complete each chart in less than five minutes and score 98% or better.
Curated OER
Five Minute Frenzy Charts (F)
In this multiplication facts worksheet, students complete four 10 by 10 grid charts with multiplication facts to 144. Students try to complete each chart in less than five minutes and score 98% or better.
Curated OER
Five Minute Frenzy Charts (G)
In this multiplication facts worksheet, students complete four 10 by 10 grid charts with multiplication facts to 144. Students try to complete each chart in less than five minutes and score 98% or better.
Scholastic
Adding and Subtracting Ten
Developing fluency with basic addition and subtraction is fundamental to the success of all young mathematicians. This four-day lesson series begins with learners using ten-frames and hundreds charts to recognize patterns when adding and...
Code.org
Making Data Visualizations
Relax ... now visualize the data. Introduce pupils to creating charts from a single data set. Using chart tools included in spreadsheet programs class members create data visualizations that display data. The activity encourages...
Curated OER
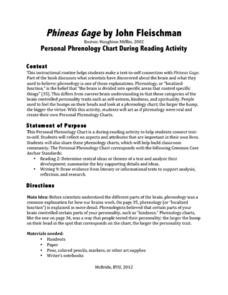
Phineas Gage: Personal Phrenology Chart During Reading Activity
Phrenology, the belief that parts of your brain control certain aspects of your personality, is described in Phineas Gage: A Gruesome but True Story About Brain Science. While we now know much more about the brain, learners use this idea...
Curated OER
Write the Missing Numbers
Which numbers are missing on these hundreds charts? Beginning counters fill in the blank squares in a set of hundreds charts. One simply has the numbers 1 and 100, while the others are missing every other number, only even numbers, or...
Math Moves U
Collecting and Working with Data
Add to your collection of math resources with this extensive series of data analysis worksheets. Whether your teaching how to use frequency tables and tally charts to collect and organize data, or introducing young mathematicians to pie...
Open Oregon Educational Resources
Beginning Excel
How can Microsoft Excel help manage data in people's personal and professional lives? Using the Beginning Excel eBook, scholars learn the basics of creating, editing, and using spreadsheets. They explore spreadsheet design, formulas,...
Yummy Math
US Holiday Candy Sales
Candy is a big business! Calculate the amount of money consumers spent on major holidays—Easter, Halloween, Christmas, Hanukkah, and Valentine's Day—based on the total amount of candy sales from 2011 and the percentage of each holiday's...
Do2Learn
T-Chart (Basic)
T-charts make a great note taking tool. Here's a template for a basic one appropriate for all learners and all subject areas.
Fluence Learning
Writing About Informational Text: Everybody Can Bike
A three-part assessment challenges scholars to read informational texts in order to complete three tasks. Following a brief reading, class members take part in grand conversations, complete charts, and work in small groups to research...
Fluence Learning
Writing About Literary Text: Wise or Foolish?
A three-part assessment promotes reading comprehension skills. Class members read literary texts and take notes to discuss their findings, answer comprehension questions, write summaries, and complete charts.
PBS
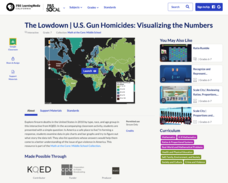
The Lowdown — U.S. Gun Homicides: Visualizing the Numbers
Is gun violence a big issue in America? Pupils explore gun deaths by type, race, and age group in a Math at the Core: Ratios interactive. The class tries to determine whether America is a safe place to live and use bar graphs and pie...
Bowland
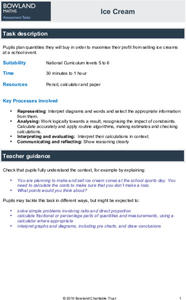
Ice Cream
Make sure there is enough ice cream on hand. Learners try to find out how much ice cream to buy for a sports event. Scholars use a pie chart showing the percent of a sample of people who like different flavors of ice cream. Using the...
Curated OER
Students Favorites
Students complete activities using a frequency table and construct a pie graph for the data. In this frequency table lesson, students complete a survey to find data for a frequency table. Students use the given link to make a pie graph...
Curated OER
Holiday Greeting Cards: A Graphing Activity
Students examine statistics about the popular type of greeting cards and create pie or bar chart using an online tool. They illustrate the sales statistics for the greeting cards before making the charts.
Curated OER
Working Out The Workout: Chart Activity
In this chart worksheet, students complete one column in a chart to determine total hours of exercise time, then use the chart to complete 4 additional questions.
Curated OER
Charting Historical Gas Prices
Learners investigate the historical and current prices of a gallon of gasoline. Using an online tool, they calculate the inflation-adjusted cost of gasoline over the years, and create a graph to demonstrate the actual cost vs. the...
Curated OER
Vocabulary Charts
Students create their own vocabulary charts. They divide into groups and view an example of a vocabulary chart imbedded in this plan. Then, they create their own chart which is based on a particular subject area.
Other popular searches
- Charts and Graphs
- Multiplication Charts
- Maps and Charts
- Tally Charts
- Pie Charts and Graphs
- Pie Chart
- Multiplication Charts to 100
- Reading Charts and Graphs
- Behavior Charts and Graphs
- Charts and Graphs Candy
- Interpret Charts and Graphs
- Charts and Graphs Christmas


