Curated OER
It's a Grand Ol' Government!
Students discuss the three branches of government and the different levels. They talk about the purpose of laws and use the Internet to locate information about governments. They watch the video, "United States Constitution" and look up...
Curated OER
Water Usage and Conservation
Pupils investigate water usage at school and at home. They use graphs and tables to evaluate water usage. Students describe possible water conservation measures. They use graphs and tables to relate data as part of a written report.
Curated OER
Arrange the Classroom (Part 1 of 3)
Fifth graders arrange the classroom using all the moveable objects and through the exploration of area and perimeter. They determine the area of the classroom, create and label model pieces of furniture using graph paper, and create a...
Curated OER
Design-A-Room Project (Part 3 of 3)
Students culminate a unit on measurement with a focus on area and perimeter. They design a floor plan of their dream room on graph paper showing the proper area and perimeter. They plan the budget for their room and make a 3-D scale...
Curated OER
Community and Colonization
Eighth graders explore the nature of the European colonization in the Americas. They compare how it relates to the inception of their community. Students identify the major players in America's colonization and explore the motivations...
Curated OER
Under The Sea
Second graders study how a tsunami is formed by underwater events such as earthquakes, volcanoes or landslides. They discuss what they knew about living and non-living things in the ocean.
Curated OER
What Time Is It?
Fourth graders distinguish between analog and digital clocks and read time from both types. In this clock reading lesson, 4th graders discuss the types of clocks and the time zones. Students find times in specific time zones. Students...
Curated OER
Bias in Statistics
Students work to develop surveys and collect data. They display the data using circle graphs, histograms, box and whisker plots, and scatter plots. Students use multimedia tools to develop a visual presentation to display their data.
Curated OER
Civil War Research
Eighth graders research different aspects of the Civil War using various multi-media techniques. Students create a report based on their research that includes views of the war from the point of view of the North, South and slaves.
Curated OER
Exploring Multiplication Functions
Fourth graders investigate the terms "factor" and "product." In this mathematics lesson, 4th graders practice solving problems to find the products and factors present in different algebraic expressions.
Curated OER
Women's Wartime Roles
Students explore the role of women during times of war. They examine the various roles that women have played in wars throughout United States history and how they have changed over time. In addition, they role-play presentations as if...
Curated OER
The Sixties Protests and Social Change
Students identify, examine and analyze photographs of the sixties to determine the forces of social change at work in America during this decade. They determine the goals of each movement and the methods used by each to achieve those goals.
Curated OER
Technology in the Classroom
Learners in French class practice using the Internet to research information. After researching a region in France, they used the information to create a PowerPoint presentation. They present their slides to the class and discover the...
Curated OER
Bias in Journalism
Pupils evaluate the credibility and reliability of various sources. Students survey the coverage of a particular event in different newspapers, select a current event and compare different perspectives. They write an article...
Curated OER
Heritage: How did the pioneers impact Utah's environment
Fourth graders explore and refine the application of media, techniques, and artistic processes. They examine the environment of a landmark or place in Utah that was altered by the original settlers and determine how it was changed and...
Curated OER
Arthropod Data Collection
Students describe the life cycle of various bugs as well as their predators and feeding habits. The class participates in a discussion of the various methods scientists use to gather data including research and experiment. After...
Curated OER
Linkages Between Surface Temperature And Tropospheric Ozone
Students collect and interpret data to make predictions about the levels of ozone in the atmosphere. Using the internet to collect data students use their collected data to create a line graph for analysis. Students make mathematical...
Curated OER
Trouble in the Troposphere
Students Use data sets from MY NASA DATA to produce graphs comparing monthly and yearly ozone averages of several U.S. cities. They analyze and evaluate the data and predict trends based on the data. In addition, they discuss and...
Curated OER
Surface Air Temperature Trends of the Caribbean
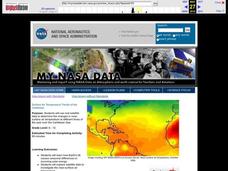
Students investigate the seasonal changes to sea surface and near-surface air temperatures near the equator. They use actual satellite data to track and graph the differences in air and sea temperatures during different seasons in the...
Curated OER
Trends of Snow Cover and Temperature in Alaska
Students compare NASA satellite data observations with student surface measurements of snow cover and temperature. They practice data collection, data correlations, and making scientific predictions.
Curated OER
Valley Forge
Students describe how location, weather, and physical environment affect the way people live, including the effects on their food, clothing, shelter, transportation, and recreation. They also describe the lives of American heroes who...
Curated OER
social studies: Life in Colonial America
Students explore the trials and tribulations early colonial life and note its successes. Through literature, Internet research, and interactive software, they engage in various activities to evaluate early social and cultural development.
Curated OER
Roles of the President
Students read a document which explains the roles and responsibilities of the President of the United States. In groups, they tour the George Bush Presidential Museum and participate in a Presidential scavenger hunt. Once back in the...
Curated OER
Line Graphs 4
In this graph worksheet, students interpret given line graphs. They determine the range, and identify the range in a set of data. This one-page worksheet contains approximately 14 problems.
Other popular searches
- Maps and Charts
- Analyze Maps and Charts
- Reading Maps and Charts
- Ireland Maps and Charts
- Tables, Maps and Charts
- Maps Graphs and Charts
- Maps, Charts, Globes
- Interpreting Charts and Maps
- Tables Maps and Charts
- Graphs, Charts and Maps
- Graphs\, Charts and Maps
- Word Maps and Charts


