Curated OER
Draw Shapes on the Grid: Independent Practice 2
In this drawing worksheet, students draw shapes on a coordinate plane at the specified location. They interpret a given ordered pair and then draw a star, circle, triangle, or square as directed. This one-page worksheet contains two...
Curated OER
Comparing Fractions 7
In this elementary math worksheet, 3rd graders compare circle graphs written as fraction models to determine the correct ratio value for the 2 questions.
Curated OER
My Test Book: Reading Pie Charts
In this math skills worksheet, students solve 9 multiple choice math problems that require them to read and interpret charts. Students may view the correct answers.
Curated OER
Histograms and Statistical Graphics
In this statistics worksheet, students solve 6 data problems. They construct a histogram of given data, they create a frequency polygon, and a stem and leaf diagram. Students create a dot plot and a pie chart for given data sets. On the...
Curated OER
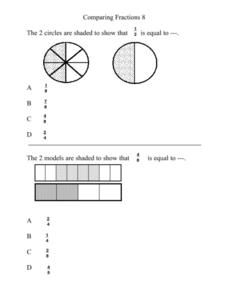
Comparing Fractions 8
In this elementary math worksheet, 5th graders compare fractions using a pie chart and practice finding the values in the multiple choice format.
Curated OER
Venn Diagrams, Part 3
Can your first graders interpret Venn diagrams? Different sets of clues help pupils narrow down a specific number in different shapes. They determine odds and evens, greater than or less than, and what shape the number is in. A fun...
Balanced Assessment
Fit-Ness
Serve four towns with one bus route. Pupils develop a bus route that meets certain criteria to serve four towns. They determine which of the routes would best serve all of them. Individuals then hypothesize where a fifth town should be...
Concord Consortium
Line of Sight
There's no way around it—learners must use trigonometry to model the line of sight around a race track! Using the starting line as the origin, pupils model the straight line distance to any car using a trigonometric expression. The...
Willow Tree
Solving Inequalities
What does solving an inequality have in common with solving an equation? Almost everything! A math resource focuses on the one exception. The examples lead learners through the steps of solving an equality when multiplying or dividing by...
Virginia Department of Education
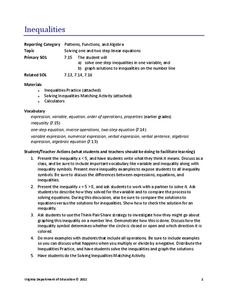
Inequalities
Not all resources are created equal — and your class benefits! Scholars learn how to solve one-step inequalities using inverse operations. They complete an activity matching inequalities to their solutions.
Los Angeles County Office of Education
Assessment For The California Mathematics Standards Grade 6
Test your scholars' knowledge of a multitude of concepts with an assessment aligned to the California math standards. Using the exam, class members show what they know about the four operations, positive and negative numbers, statistics...
Curated OER
Sunshine Math 3
In this word problems worksheet, learners read and problem solve nine mathematical word problems involving grids, measurement, compensation and angles.
Special Olympics
Special Olympics Volleyball Coaching Guide: Teaching Volleyball Skills
From warm-up routines and stretches to skill progressions and passing drills, this is an absolute must-have resource for coaches teaching volleyball to a group of learners with diverse needs and skills.
Curated OER
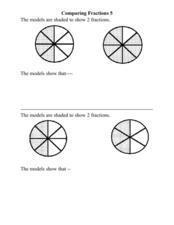
Comparing Fractions 5
In this elementary math worksheet, 4th graders compare the circle graphs expressed as fraction models in order to determine the fraction values for the four graphs.
Curated OER
Comparing Fractions 6
For this math worksheet, students compare circle graphs that are used as fractional models. They determine the fraction value for each while writing each ratio for the four questions.
Curated OER
Periodic Functions
In this calculus worksheet, students identify important rules and properties of the unit circle. They differentiate between polar and complex coordinates. There are 20 questions about the unit circle.
Curated OER
Twinkle, Twinkle, Little Star Lab
For this space science worksheet, 7th graders use the star circles given but the teacher to complete 14 short answer questions. They plot the stars on the graph.
Curated OER
Congruence Statements
In this congruence statements worksheet, 10th graders solve and complete 16 various types of problems. First, they complete each congruence statement listed. Then, students graph each set of points on the coordinate plane provided. They...
Curated OER
Linear Equations
In this algebra worksheet, students solve linear equations through graphing and the use of formulas. There are 34 questions ranging from addition and subtraction of linear equations to graphing and substitution.
Curated OER
Classifying Conic Sections
For this conic section worksheet, students classify 8 conic sections. They write the standard form of 8 conic sections. Students sketch the graph of six shapes. For the graphs, students are directed to find either vertex and focus, or...
Curated OER
Population Biology
In this population activity, students will compare two population growth graphs and complete four short answer questions. Then students will investigate the factors that influence population growth in 8 fill in the blank statements and 4...
Curated OER
Velocity
In this pre-calculus learning exercise, students calculate the velocity of a linear graph by observing the slope of a line. There are 10 velocity questions.
Curated OER
Properties of Exponential Functions
In this algebra worksheet, students graph exponential equations and use the formula to translate the graph on a coordinate plane. There are 3 word problems.
Curated OER
Where in the World? Your Relative Location
In this geography worksheet, learners complete a graph showing their location on the planet earth. Students determine what percent of all people on Earth are on their continent, in their country and part of their town.
Other popular searches
- Percent Circle Graph
- Circle Graph Worksheet
- Circle Graph Template
- Interpreting Circle Graphs
- Circle Graph Protractor
- Circle Graph Activity
- Reading Circle Graphs
- Circle Graphs Pie Charts
- Circle Graph Central Angle
- Bar and Circle Graphs
- Circle Graph in Excel
- Family Budget Circle Graph


