Curated OER
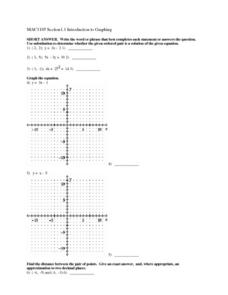
Introduction to Graphing
In this graphing worksheet, students graph linear equations on a coordinate plane. Students identify the slope and y-intercept of each problem, find the midpoint of a line, and the distance between given points. Given an equation,...
Curated OER
Data Analysis Challenge
In this data analysis worksheet, young scholars work with a partner to collect information for a survey. The information is then compiled into a graph. Students must indicate their survey question, the target audience, predict the...
CPO Science
Physics Skill and Practice Worksheets
Stop wasting energy searching for physics resources, this comprehensive collection of worksheets has you covered. Starting with introductions to the scientific method, dimensional analysis, and graphing data, these skills practice...
Lane Community College
Review Sheets: Trigonometry
Review guide, practice test, homework packet? Yes, yes, and yes as it's all possible with a wonderful trigonometry packet. Every type of problem is there, starting from the unit circle and ending with conic sections.
Curated OER
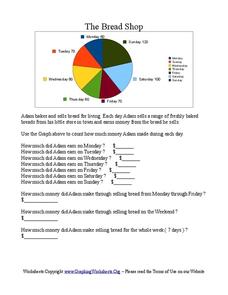
The Bread Shop
In this pie chart worksheet, learners use the pie chart graph to count the money Adam made in the Bread Shop. Students complete 10 questions.
Curated OER
Probability Fun
What are the chances? Probability comes into play in this worksheet as mathematicians examine a circular chart with images, determining the possibility that the "spinner" will land on each of the images. Appropriate for younger...
Curated OER
Circular Trigonometric Functions
In this Pre-calculus/Trigonometry worksheet, students estimate the amplitude, period, and horizontal and vertical translations of a graph and find a rule that models the data. The three page worksheet contains fourteen problems. Answers...
Curated OER
Statistics Problems
In this statistics learning exercise, 3rd graders answer questions about different graphs including bar graphs, picture graphs, line graphs, and more. Students complete 20 multiple choice questions.
Curated OER
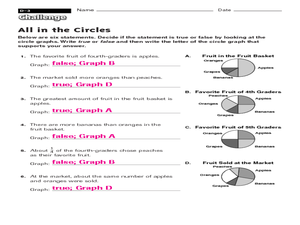
All in the Circles
In this circles worksheet, learners use 4 circle/pie chart graphs to answer a set of 6 questions. Answers are included on page 2.
Curated OER
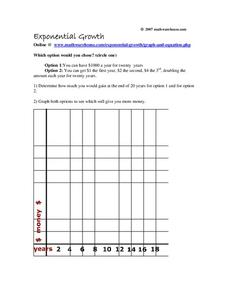
Exponential Growth
Explore exponential growth with this interesting scenario: You can either have $1000 a year for twenty years, or you can get $1 for the first year, $2 for the second, $4 for the third, etc, doubling in amount each year for twenty years....
Curated OER
Word Problem Practice Workbook
Need worksheets that challenge your middle schoolers to apply their understanding of math? Problem solved! From integers, fractions, and percents, to algebra, geometry, and probability, over 100 pages of word problem worksheets are...
Jason Learning
Tech in the Cycle
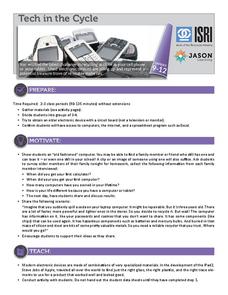
It might not be easy, but it is worth recycling electronics. Small groups determine the percentage of the materials that make up an iPad 2 and display the information in a circle graph. They then research the recycling process for...
Curated OER
Circles and Their Equations
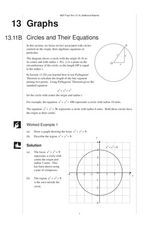
In this circle and their equations worksheet, students read about circles and algebraic equations, look at examples and complete exercises.
Curated OER
Transformations And Animations in Polar Graphing
In this math worksheet, they investigate the polar graph of: r = a + b sin (t), for various values of a and b. This is called a limacon and is applied to the definition of a transformation.
Curated OER
Using Data From a Graph
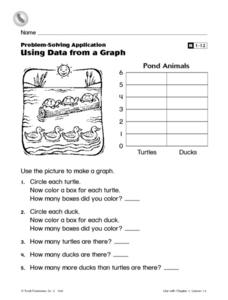
In this graphing worksheet, students create a bar graph with information from a picture of some pond animals. Students answer 5 questions about the graph.
Curated OER
Family Activity: Bar Graphs and Line Graphs
In this math worksheet, students work at home with a family member on a graphing activity. Students count the number of cans, glass jars, boxes and bags in the pantry. Students make a bar and a line graph to represent the data.
Curated OER
Graph It!
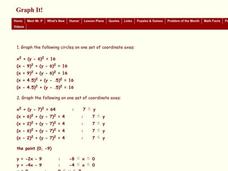
In this graph it worksheet, students graph inequalities on a coordinate plane. This one-page worksheet contains 3 problems.
Curated OER
Statistical Inquiry
In this statistical inquiry worksheet, students analyze and interpret a variety of diagrams such as a scatter plot, bar graph and pie charts. They create tables and other diagrams to support given data. This two-page worksheet contains 3...
Curated OER
Triangle and Circle Trigonometry
In this Pre-calculus/Trigonometry worksheet, students apply advanced triangle and circle trigonometry to solve application problems. The three page worksheet contains sixteen problems. Answers are not included.
Curated OER
Favorite Fruit
In this graphing activity, 1st graders create a bar graph showing the favorite fruits of their classmates. They analyze their bar graph by answering five comprehension questions.
Curated OER
Standard Form of a Circle
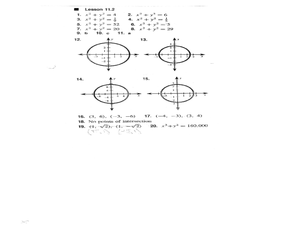
In this algebra worksheet, students write equations for a circle on a graph or using a radius. They find intersections and points on a graph.
Noyce Foundation
Pizza Crusts
Enough stuffed crust to go around. Pupils calculate the area and perimeter of a variety of pizza shapes, including rectangular and circular. Individuals design rectangular pizzas with a given area to maximize the amount of crust and do...
Curated OER
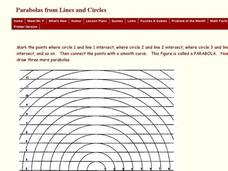
Drawing Three Parabolas from Lines and Circles
In this parabola worksheet, students draw three parabolas by connecting points. The points are formed at the intersection of circles and lines.
West Contra Costa Unified School District
Conics Introduction and Parabolas
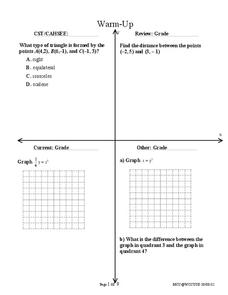
Where did conic sections get their name? The equation and graph of a parabola are developed from the definition of the conic section. Teacher examples on graphing the equation and writing an equation from the graph round out the plan.
Other popular searches
- Percent Circle Graph
- Circle Graph Worksheet
- Circle Graph Template
- Interpreting Circle Graphs
- Circle Graph Protractor
- Circle Graph Activity
- Reading Circle Graphs
- Circle Graphs Pie Charts
- Circle Graph Central Angle
- Bar and Circle Graphs
- Circle Graph in Excel
- Family Budget Circle Graph


