Curated OER
The Unit Circle
Students relate the trigonometric functions to the coordinates of the unit circle with access to explorelearning.com. They determine the signs of trigonometric functions in each quadrant.
Curated OER
Picture Graphs
First graders work with picture graphs, create their own individual graphs, and construct and read graphs.
Curated OER
Every Graph Tells A Story
Seventh graders explore linear equations. In this graphing lesson, 7th graders explore constant rates of change. Students discover the real-life application of graphs and demonstrate their ability to read graphs and write corresponding...
Curated OER
Graphing Linear, Circular, and Parabolic Inequalities
For this graphing worksheet, students are given nine inequalities and then must graph five of their intersections. A grid and cartoon hint are provided.
Curated OER
Equations of Circles
Learners will define circle and radius. In this radius lesson, students are given a circumference, they will write an equation and sketch the circle. Learners will match graphs of circles to their equations.
Curated OER
Using Data to Make Graphs: Pretest
In this data worksheet, 5th graders answer multiple choice questions on data and graphs. Students answer 10 multiple choice questions.
Curated OER
Understanding Line Graphs
In this line graphs worksheet, 4th graders study a line graph with time and height and points A-D. Students answer four short answer questions relating to the line graph.
Curated OER
Reading Graphs
For this reading graphs practice worksheet, students examine a graph and respond to 5 questions that require them to record the coordinates of 5 shapes on the gridded graph.
Curated OER
Parabola - Equations and Graphs
In this parabola activity, students match graphs of parabolas to the correct equation. This one-page activity contains ten matching problems.
Curated OER
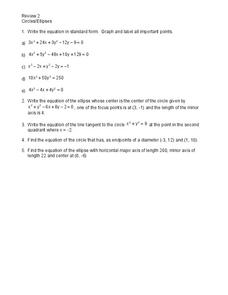
Circles and Ellipses
In this circles and ellipses worksheet, students solve and complete 5 different types of problems. First, they write each equation in standard form. Then, students graph and label Write the equation of the ellipse whose center is the...
Curated OER
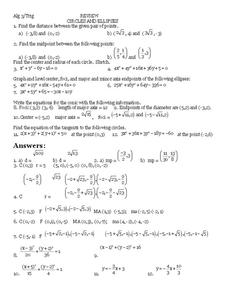
Circles and Ellipses
In this circles and ellipses worksheet, students solve and complete 12 different types of problems. First, they find the distance between the given pair of points. Then, students find the center and radius of each circle and sketch. They...
Curated OER
Reciprocal Graphs
In this graphing worksheet, students graph 8 reciprocal graphs. Students graph the reciprocal of a given graph. Students graph reciprocal cubics, quadratics, linear, circles, and fourth degree functions.
Curated OER
Pictures, Graphs and Diagrams
In this algebra worksheet, students define vocabulary related to circles, and other conics. They graph hyperbolas and eclipse. There are 20 questions.
Curated OER
Froot Loop Favorites
In this Froot Loop favorites worksheet, students solve and complete 3 different problems that include data tables related to their Froot Loop favorites. First, they determine what fraction of the class voted for each color listed in the...
Curated OER
Graphs: All About Our Class
Students respond to survey questions, discuss results, brainstorm ways to represent survey information, and create table of class results. They find mean, range, and percentages, and create graph to display results.
Curated OER
Discovering PI
In this pi worksheet, students identify and complete 4 different problems that include pi and graphing data points. First, they complete the chart at the top by measuring the diameter and circumference of each object. Then, students plot...
Curated OER
Ellipses and Kepler's First Law
The class examines graphs in the form r = F(¿¿) in polar coordinates (r, ¿¿), in particular with the circle, ellipse and other conic sections. They determine the nature of an ellipse by studying the role of the semimajor axis and...
Curated OER
7th Grade Math Worksheet
In this integers activity, 7th graders solve 10 different problems that include various types of integers and graphs. First, they determine the sum of 3 consecutive integers. Then, students find the ratio between 2 areas of similar...
Curated OER
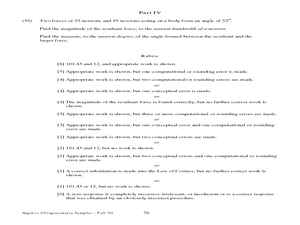
Scoring Guide for the Algebra 2/Trigonometry Test Sampler
Students take an Algebra II/Trigonometry sample test. In this Algebra II/Trigonometry sample sample test lesson, students take a sample test for Algebra 2/Trigonometry. Students solve 39 multiple choice/short answer questions about...
Curated OER
Generate Measurement Data Word Problems
Using a set of simple data, learners create a line plot to organize the information. This data includes only single-digit numbers and the highest number is six. Because the answer is explained and illustrated at the bottom, project this...
Curated OER
Analyzing Equations Through Slope and Y-int
With problems applying to modern-day topics like Netflix and McDonald's, math whizzes analyze graphs and investigate the slopes. In this algebra worksheet, learners identify the slope and y-intercept of the given equations. They graph...
Curated OER
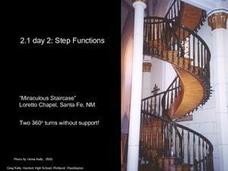
Calculus 2.1 day 2 - Step Functions
"Step functions" are sometimes used to describe real-life situations. This extensive lesson with many practice examples demonstrates two such functions: the Greatest Integer Function and the Least Integer Function. The commands on the...
EngageNY
Why Call It Tangent?
Discover the relationship between tangent lines and the tangent function. Class members develop the idea of the tangent function using the unit circle. They create tables of values and explore the domain, range, and end behavior of the...
University of North Texas
Library of Functions
Join the family picnic and see how all the functions come together in a PowerPoint that highlights their main features. As it includes topics such as domain, range, and intercepts, the slides are a great guide to promote class discussions.
Other popular searches
- Percent Circle Graph
- Circle Graph Worksheet
- Circle Graph Template
- Interpreting Circle Graphs
- Circle Graph Protractor
- Circle Graph Activity
- Reading Circle Graphs
- Circle Graphs Pie Charts
- Circle Graph Central Angle
- Bar and Circle Graphs
- Circle Graph in Excel
- Family Budget Circle Graph


