CK-12 Foundation
Vertical Line Test: Exploration
What do vertical lines have to do with functions? Individuals slide a vertical line through four different graphs. They use that vertical line test to determine if the graphs represent functions.
EngageNY
Curves from Geometry
Take a another look at ellipses. The seventh segment in a series of 23 in a Precalculus module continues to investigate the graph and equation of an ellipse from the previous instructional activity. Scholars investigate the fact that the...
Concord Consortium
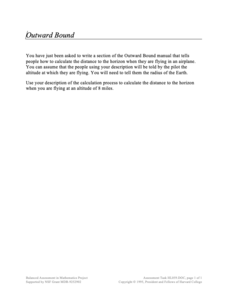
Outward Bound
Just how far can I see? The short assessment question uses the Pythagorean Theorem to find the distance to the horizon from a given altitude. Scholars use the relationship of a tangent segment and the radius of a circle to find the...
Curated OER
Graph a Panther's Diet
Pupils examine the diet of panthers. In this interpreting data instructional activity, students collect data on the panther's diet and chart the data in bar and pie graphs.
Curated OER
Understanding Statistics
In this statistics worksheet, students examine and interpret pictographs and line graphs. Students analyze the provided data in order to create bar graphs, circle graphs, and box and whisker plots. The nine page worksheet accompanies a...
Curated OER
Timed Multiplication Test Graphs
Students use the tools of data analysis for managing information. They solve problems by generating, collecting, organizing, displaying histograms on bar graphs, circle graphs, line graphs, pictographs and charts. Students determine...
Curated OER
Circles
In this circles worksheet, 10th graders solve and complete 16 various types of problems. First, they state the center and radius for the given equation and graph. Then, students determine if each point is on the circle, in its interior,...
Curated OER
Skittles, Taste the Rainbow
Fifth graders learn and then demonstrate their knowledge of a bar and a circle graph using the classroom data. Students are given a pack of skittles candy. Students create a bar and circle graph indicating the results of the contents of...
Curated OER
Introductory Algebra Chapter 3 Review
In this math worksheet, students find the solutions to the problems while interpreting the line, bar, and circle graphs. The examples are given to help in the context of each objective.
Curated OER
Evidence of Change Near the Arctic Circle
Students analyze graphs and make conclusions about climate change. In this climates lesson students produce graphs and identify relationships between parameters.
Curated OER
Bias in Statistics
Students work to develop surveys and collect data. They display the data using circle graphs, histograms, box and whisker plots, and scatter plots. Students use multimedia tools to develop a visual presentation to display their data.
Curated OER
Introduction to Graphs
Students poll classmates to gather information for a graph. They identify three types of graphs (bar, line, table). Students create each type of graph using data gathered from classmates.
Curated OER
Introduction to Graphing
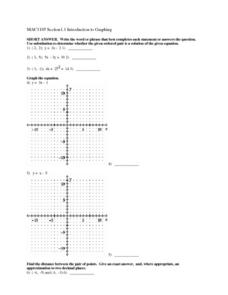
In this graphing worksheet, students graph linear equations on a coordinate plane. Students identify the slope and y-intercept of each problem, find the midpoint of a line, and the distance between given points. Given an equation,...
Curated OER
Data Analysis Challenge
In this data analysis worksheet, young scholars work with a partner to collect information for a survey. The information is then compiled into a graph. Students must indicate their survey question, the target audience, predict the...
Curated OER
Three for the Money: The Degree/Diameter Problem
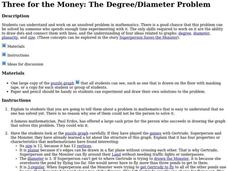
Students explore the degree, diameter, planarity, and size of graphs. In this degree, diameter, planarity, and size of graphs lesson, students try to construct a graph with more than 12 vertices that satisfy all other requirements. ...
Curated OER
Trigonometry Review Sheet
Get the trig facts fast, and use the review sheet as a guide in the classroom. The worksheet also includes a document version if any changes are needed to the problems. The information includes a small degree/radian chart, a graph of all...
CPO Science
Physics Skill and Practice Worksheets
Stop wasting energy searching for physics resources, this comprehensive collection of worksheets has you covered. Starting with introductions to the scientific method, dimensional analysis, and graphing data, these skills practice...
Curated OER
Trig Cheat Sheet
Your pre-calculus learners will make use of this wonderful cheat sheet that summarizes all things trigonometric. Definitions based on both the unit circle and the right triangle are included, as well as many convenient trigonometric...
Lane Community College
Review Sheets: Trigonometry
Review guide, practice test, homework packet? Yes, yes, and yes as it's all possible with a wonderful trigonometry packet. Every type of problem is there, starting from the unit circle and ending with conic sections.
Curated OER
Graphing With a Spreadsheet
Fourth graders review how to create bar, line and circle graphs. Using jelly beans, they collect data and present it in a bar graph form. They enter the same data into a spreadsheet and watch as the program creates the same graph. They...
Curated OER
Graphing Made Easy
Fourth graders discover the appropriate way to construct and analyze bar, line, picto, and circle graphs. They set up frequency tables and perform some statistical analysis (mean, median, and mode) on their data.
Curated OER
The Bread Shop
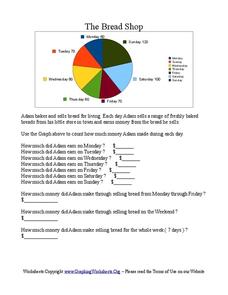
In this pie chart worksheet, learners use the pie chart graph to count the money Adam made in the Bread Shop. Students complete 10 questions.
Curated OER
Probability Fun
What are the chances? Probability comes into play in this worksheet as mathematicians examine a circular chart with images, determining the possibility that the "spinner" will land on each of the images. Appropriate for younger...
Computer Science Unplugged
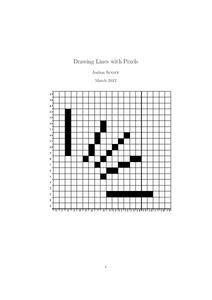
Drawing Lines with Pixels
How do the computers keep it straight? Using the provided algorithms, class members draw a line and a circle using pixels. They then check the drawings using a straight edge and compass to determine the accuracy of their drawings.
Other popular searches
- Percent Circle Graph
- Circle Graph Worksheet
- Circle Graph Template
- Interpreting Circle Graphs
- Circle Graph Protractor
- Circle Graph Activity
- Reading Circle Graphs
- Circle Graphs Pie Charts
- Circle Graph Central Angle
- Bar and Circle Graphs
- Circle Graph in Excel
- Family Budget Circle Graph


