Curated OER
Circular Motion
Students investigate circular motion in two different activities. In the first, students observe the path of a rolling marble on a paper plate. In the second, students play a game of catch using a tennis ball inside a plastic bag. ...
Curated OER
The Unit Circle
Students solve problems using the unit circle. In this precalculus lesson, students identify angles using the properties of the unit circle. They observe the trigonometric graphs and sine, cosine and tangent.
Curated OER
Tangents to a Circle
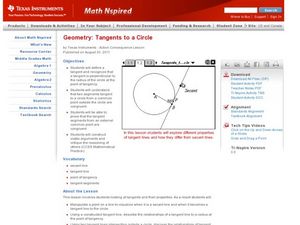
Students construct tangent lines. In this geometry lesson, students identify the point of tangency, secant and tangent lines. They graph the lines on the Ti and make observations.
Curated OER
BUS: Farming: It's A Fact (Ag)
Students create two different types of graphs from the information in the "Farm Facts" booklet (i.e., bar graph, pie chart, etc.). They calculate where your food dollars are spent (on and off farm).
Curated OER
Family Activity: Bar Graphs and Line Graphs
In this math worksheet, students work at home with a family member on a graphing activity. Students count the number of cans, glass jars, boxes and bags in the pantry. Students make a bar and a line graph to represent the data.
Curated OER
Australian Settlers
Students interpret graphs and research events to identify links between events in the world and the arrival and plight of immigrant groups. They discuss the myths about immigration.
Curated OER
Graph It!
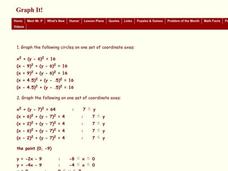
In this graph it worksheet, students graph inequalities on a coordinate plane. This one-page worksheet contains 3 problems.
Curated OER
Statistical Inquiry
In this statistical inquiry worksheet, students analyze and interpret a variety of diagrams such as a scatter plot, bar graph and pie charts. They create tables and other diagrams to support given data. This two-page worksheet contains 3...
Curated OER
Triangle and Circle Trigonometry
In this Pre-calculus/Trigonometry worksheet, students apply advanced triangle and circle trigonometry to solve application problems. The three page worksheet contains sixteen problems. Answers are not included.
Curated OER
Right Triangles and Unit Circles
Students evaluate the six trigonometric values of a trig function. For this trigonometry lesson, students use the Unit Circle to find the values of right triangles and their angles. They identify an angle of elevation and depression.
Curated OER
Twelve Days of Christmas
Learners create charts and graphs using a spreadsheet. They chart the number of each gift given day by day from the song, "The Twelve Days of Christmas." They create a bar graph and a circle graph from their data on the spreadsheet.
Curated OER
Speed + Graphing = Winners!
Fifth graders take addition timed tests every day for a two week period. Using the data from the timed tests, they create a bar graph using Microsoft Excel computer software, a personal bar graph using graph paper and colored pencils,...
Curated OER
The Solar System
High schoolers construct a sketch of the planets in our solar system using concentric circles and angles. In this solar system lesson plan, students plot the position of each planet on concentric circles using graph paper. The sun is...
Curated OER
Favorite Fruit
In this graphing activity, 1st graders create a bar graph showing the favorite fruits of their classmates. They analyze their bar graph by answering five comprehension questions.
Curated OER
3.14159265
Students discover the value of Pi. In this value of Pi lesson, students measure the circumference and diameter of various circles on their graphing calculator. Students find the ratio of the circumference to the diameter and plot the...
Curated OER
Graphs
Students explore graphs and define the different ways they are used to display data. In this algebra lesson, students collect data and plot their data using the correct graph. They draw conclusions from their graphs based on their data.
Curated OER
Excel temperature Graphs
Students gather data about the weather in Nome, Alaska. In this Nome Temperature lesson, students create an excel graph to explore the weather trends in Nome. Students will find the average weather and add a trend line to their graph.
Curated OER
Creating a Graph
Students brainstorm favorite things to do during the summer. They survey classmates to collect data, arrange it in a chart, and create graphs using ClarisWorks.
Curated OER
ELECTRICITY 1
Fifth graders examine the importance of electricity to their everyday lives, practice plotting and interpreting data on a bar graph, and reflect in their journals about how their lives would change without electricity.
Curated OER
The Numbers Tell the Story
Students demonstrate how to gather and interpret statistical data. In this data analysis lesson, students search for statistics on the health effects of smoking and place the information into charts. Students create these charts online...
Curated OER
Graphing the Past Using Today's Technology
Eighth graders research statistical data regarding their current social studies unit. They write questions about the measures of central tendency, collect and analyze the data, insert the data into a spreadsheet, and generate graphs.
Curated OER
Circle Relationships
Students explore circles. In this geometry instructional activity, students explore the relationship between the circumference of a circle, the distance a ball travels, and the number of rotations the ball must make in order to travel a...
Curated OER
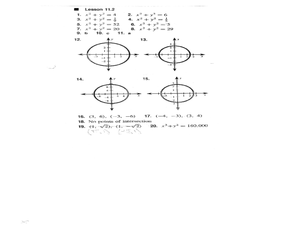
Standard Form of a Circle
In this algebra worksheet, students write equations for a circle on a graph or using a radius. They find intersections and points on a graph.
Noyce Foundation
Pizza Crusts
Enough stuffed crust to go around. Pupils calculate the area and perimeter of a variety of pizza shapes, including rectangular and circular. Individuals design rectangular pizzas with a given area to maximize the amount of crust and do...
Other popular searches
- Percent Circle Graph
- Circle Graph Worksheet
- Circle Graph Template
- Interpreting Circle Graphs
- Circle Graph Protractor
- Circle Graph Activity
- Reading Circle Graphs
- Circle Graphs Pie Charts
- Circle Graph Central Angle
- Bar and Circle Graphs
- Circle Graph in Excel
- Family Budget Circle Graph


