Curated OER
World Oil Packet
In this oil consumption worksheet, students analyze the data about oil consumption and production in 3 graphs. Students then respond to 12 questions about the data.
Curated OER
Graphing the Daily Revenue of Miami Seaquarium
Seventh graders compile a table of the revenues of the 8 eateries (a combined total), Main Gate admissions, and the Gift Shop.
Curated OER
Graphing the Past Using Today's Technology
Eighth graders research and gather information from such sources as Microsoft Encarta, World Wide Web sites, and other sources using computer software to collect data.
Curated OER
Atlatl Lessons Grades 4-12: Lesson for Beginning Users of Atlatl
Sixth graders determine the mean, range median and mode of a set of numbers and display them. In this data activity students form a set of data and use computer spreadsheet to display the information. They extend of the process by...
Curated OER
Gateway Arc Length
Learners differentiate and calculate the length of an arc. They define an arc and relate it to the area of a circle and integrate the function to solve the equations. Students use their TI calculators to graph the equation.
Curated OER
Circle the Earth - Explore Surface Types on a Journey around Earth
Students use CERES percent coverage surface data with a world map in locating landmasses and bodies of water at Earth's Equator.
Curated OER
Creating Pie Graphs Using Percents
Sixth graders examine how to convert fractions to percents and percents to fractions. They list their activities for a 24 hour period, and create a pie graph using Microsoft Works.
Curated OER
Graph Both Crusts
Fourth graders calculate the angles and construct a pie graph of the percentages of the elements in the continental and oceanic crusts. Then they analyze the results. They can be assigned the task of researching the percentages.
Curated OER
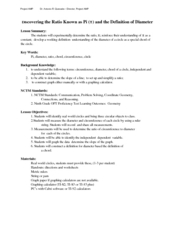
Discovering The Ratio Pi And The Diameter
Students relate the ratio of Pi to the diameter of a circle. In this geometry lesson, students investigate the relationship of the chord of the circle the the number Pi. They define ration, chord, circumference and diameter and find...
Curated OER
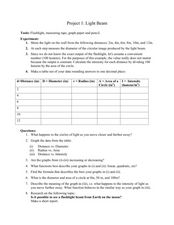
Light Beam
Students measure and convert between units. In this geometry lesson plan, students investigate through measurements of distances. They relate the properties of circle to solving problems with radius, diameter and area.
Curated OER
The Immigrants of Brooklyn: Now And Then
Students compare the immigrant population during the pre-Civil War era (1855) to that of today (2000 census data). They interpret circle and bar graphs comparing immigrant populations in Brooklyn yesterday and today, and create a class...
Curated OER
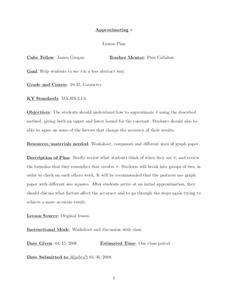
Approximating Pi
Learners approximate Pi using the lower and upper bound for the constant. In this algebra lesson, students work in groups of two to graph a circle and approximate Pi using the circumference. They repeat their estimation until they come...
Curated OER
Find and Color
For this early childhood shape recognition worksheet, students find circles, triangles, and rectangles in a picture and color them according to the instructions. Students graph the number of each of the 3 shapes on the provided table.
Curated OER
Morning Math / Homework Math
In this math worksheet, students complete ten exercises reviewing basic math skills related to place value, money, time, number sense, and graphing. A Homework Math sheet is also included reviewing the same skills.
Curated OER
Linear Inequalities
Ninth graders explore solving linear inequalities. They discuss vocabulary words and symbols associated with linear inequalities. After a demonstration by the teacher, 9th graders solve and graph inequalities. Students complete a...
Curated OER
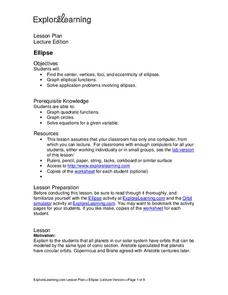
Ellipse
Students explore the concept of ellipses including finding the center, vertices's, foci and eccentricity. They assess how to graph elliptical functions and solve application problems involving ellipses. This assignment is to be completed...
Curated OER
Ellipse
Young scholars find the center, vertices, foci, and eccentricity of ellipses using the subscriptions website www.explorelearning.com. They graph elliptical functions and solve application problems involving ellipses.
Curated OER
Measurement of a Central Angle
Pupils calculate the measurement of a central angle. In this geometry lesson plan, students identify properties of circles. They use Cabri software to create and analyze graphs.
Curated OER
The Statistics of M&Ms
Students explore the topic of statistics with M and Ms. In this math lesson plan, students use candy pieces to sort and gather information needed to create a bar graph. This lesson can be adapted to accommodate students in grades 1-12.
Curated OER
Conic Sections and Locii
Students differentiate between ellipse and hyperbola. In this algebra lesson, students graph and solve elliptical equations. They use the cabri program to create the different conics and move them around.
Curated OER
Exploring Trigonometric Functions
Students are introduced to the characteristics of trigonometric functions. In groups, they analyze graphs of sine and cosine to determine the lengths of a triangle. They compare and contrast the graphical and numerical characteristics...
Curated OER
Seasons
Students explore the four seasons. Through observation activities, they explore and discuss the weather changes that occur during each season. Students create a graph of the clothing that is worn during each season.
Curated OER
Worksheet 22 - Spring 1996
students examine the potential of creating the involute for a circle. They use the concept to create new parametric equations. They graph the picture for each.
Curated OER
Worksheet 22-Fall 1995
In this math worksheet, students examine the graph of the derivative. Then they determine the critical points that correspond to the relative extrema.
Other popular searches
- Percent Circle Graph
- Circle Graph Worksheet
- Circle Graph Template
- Interpreting Circle Graphs
- Circle Graph Protractor
- Circle Graph Activity
- Reading Circle Graphs
- Circle Graphs Pie Charts
- Circle Graph Central Angle
- Bar and Circle Graphs
- Circle Graph in Excel
- Family Budget Circle Graph


