Curated OER
Exploring Centers of Triangles
Students explore properties of triangles using angle bisectors, incenters, circles, midpoints, and altitudes. They use Geometer's Sketchpad in order to create triangles and their properties.
Curated OER
Home on the Biome
Fifth graders study six major biomes, graph temperature and rainfall, and present their findings to the class.
Curated OER
Introduction to Science
Seventh graders investigate scientific methods to solve problems. They demonstrate creating data tables and graphs. They study the role of a scientist and the importance of safety in a science lab. They distinguish between an...
Curated OER
Points in a Complex Plane -- Lecture
Students review plotting points on a coordinate plane. Individually, they add and subtrace complex numbers and graph them in a complex plane. They follow along a worksheet while their teacher lectures on the new material and solve...
Curated OER
Environmental Mathematics
Eighth graders determine food that they would need to survive in the wild. They graph the best foods for their environments and rate the survivability rate for each member of their group.
Curated OER
The Cost of Life
Students research the salary for a career of interest. They consider what kind of lifestyle that career would provide and graph their information for comparison.
Curated OER
Estimation and Pattern Discovery
Students collect sunflower heads from their community garden. They estimate its seed count using different strategies. They graph their estimations on a graph and use calculators to find the actual total.
Curated OER
Hyperbolas
Students find the center, foci, vertices, and asymptotes of hyperbolas. They graph hyperbolas and determine the equation of a hyperbola with a horizontal transverse axis. They derive general coordinates for the foci of a hyperbola with a...
Curated OER
Hyperbolas
Students locate and identify the center, foci, vertices, and asymptotes fo hyperbolas. They graph equations involving asymptotes and hyperbolas. Finally, students determine the equation of a hyperbola with a horizontal transverse axis.
Curated OER
MT-A141 PreCalculus: Worksheet 6.2/6.3
In this precalculus worksheet, students use their graphing calculator to determine the coordinates for given functions. They determine the values for cosine, sign, tangent, and secant of given equations. Given an angle of elevation,...
Curated OER
Absolute Value of Linear Functions
Students identify and interpret how absolute value affects linear functions. They also graph linear functions and reflect them in a line of symmetry. Finally, students evaluate the absolute value of a constant using technology to...
Curated OER
Monkey Mayhem
In this sorting and categorizing instructional activity, students take complete a graphing experiment using monkeys in a bag. Students graph their results on the piece of paper.
Curated OER
Survival of the Fittest
Learners explore plant needs and growth. In this plant science lesson, students use a cereal box to complete a plant growth graph activity.
Curated OER
Geographic Effects on Precipitation, Water Vapor and Temperature
Students investigate the factors affecting climate using Live Access Server. In this geography lesson, students graph atmospheric data using Excel spreadsheet. They compare and contrast temperature, precipitation and water vapor of two...
Curated OER
Take a Survey!
Second graders discuss proper uses of the Internet. They complete the 8-question survey by selecting their favorite answer for each question. They click one time in the white circle to choose an answer and click Next at the bottom on...
Curated OER
Satellite Tracker
Learners use satellite tracking software to monitor different satellites. They predict and graph the motion of the space station. They create a 3-D display of its path and share it with the class.
Curated OER
Investigating the Idea of Cos
Fifth graders use cos to solve problems involving right-angled triangles. They solve equations of the form cos(++) = a, for a between -180 and 360 degrees. They state the value of cos(++) in special cases and graph y = cos(++).
Curated OER
Absolute Value of Linear Functions
High schoolers discover how abolute value affects linear functions. They complete a worksheet simulating a path for miniature golf hole in one for three figures. They construct a hole in one graph for each hole marking the X and Y...
Curated OER
Path Map for the Lake Bonneville Flood
Students use a digital atlas of Idaho to explore the effects of the Lake Bonneville Flood. They become familiar with how floods shape our earth and change landscapes. Students graph a a timeline of the rise and fall of Lake Bonneville.
Curated OER
Math And Reading
In this math and Language Arts worksheet, learners mark the vowel sound they hear for each picture and write a sentence about a picture. Students also use a graph to answer three questions.
Curated OER
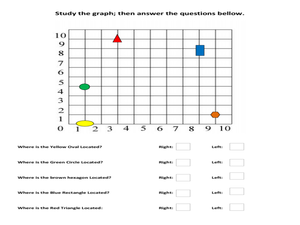
To The Right or Left?
In this right or left worksheet, students study a graph with colored shapes on it, then choose either right or left to tell where each shape is located.
Curated OER
PreCalculus Worksheet 8.4
In this precalculus worksheet, students write numbers in their trigonometric form and compute the numbers to a given power. Students explore the parametric function and trace the roots of unity. After completing eight short answer...
Curated OER
Nanofibers: Measuring the Visible to Understand the Invisible
Students compare the size and shape of tubes that can be measured, to the size and shape of "nanowhiskers" that are too small to see. They practice measuring, calculating and graphing the ratio of circumference to diameter of a circle,...
Other popular searches
- Percent Circle Graph
- Circle Graph Worksheet
- Circle Graph Template
- Interpreting Circle Graphs
- Circle Graph Protractor
- Circle Graph Activity
- Reading Circle Graphs
- Circle Graphs Pie Charts
- Circle Graph Central Angle
- Bar and Circle Graphs
- Circle Graph in Excel
- Family Budget Circle Graph


