Wish for the Future
Wish for the Future
What would be your class's ideal world 30 years in the future? What about 100 years? Use a series of activities to discuss globalization, sustainability, scientific contributions to society, and the global community of which your...
Statistics Education Web
Now You SeeIt, Now You Don't: Using SeeIt to Compare Stacked Dotplots to Boxplots
How does your data stack up? A hands-on activity asks pupils to collect a set of data by measuring their right-hand reach. Your classes then analyze their data using a free online software program and make conclusions as to the...
EngageNY
Distance and Complex Numbers 2
Classmates apply midpoint concepts by leapfrogging around the complex plane. The 12th lesson plan in a 32 segment unit, asks pupils to apply distances and midpoints in relationship to two complex numbers. The class develops a formula to...
EngageNY
Introduction to Simultaneous Equations
Create an understanding of solving problems that require more than one equation. The lesson introduces the concept of systems of linear equations by using a familiar situation of constant rate problems. Pupils compare the graphs of...
02 x 02 Worksheets
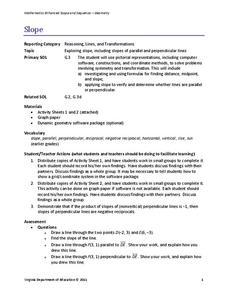
Slope
What does slope have to do with lines? Pupils work with lines and determine the slope of the lines informally and with the slope formula. Groups use their knowledge to calculate the slopes of parallel and perpendicular lines. They also...
Concord Consortium
In Oz We Tryst
The shortest distance from point A to point B is a straight line, but measuring distance gets more complicated when there are three points! Given the location of three friends, individuals determine the best point for all three friends...
Curated OER
Cooperation
In this cooperation worksheet, students read a set of guidelines on how to cooperate, then complete a set of discussion questions based on a referenced DVD. Suggestions for writing assignments and activities are also given.
Curated OER
Exercise in Perspective
In this exercise in perspectives, students are required to analyze a topic by completing six different activities. Students can work in groups, pairs or independently to complete the activity.
Curated OER
Math Club #19: Brain Twisters
In this brain twisters worksheet, 7th graders work in groups to solve 7 puzzles using logic and problems solving skills.
Curated OER
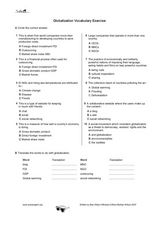
Globalization Vocabulary Exercise
In this globalization vocabulary worksheet, students are required to determine the meaning of vocabulary used in a discussion about globalization.
Curated OER
Play or Film Review
Pupils review the elements for a successful play review. In this play review lesson, students work in groups to complete peer responses, a consensus activity, and tally activity. Pupils write a play review. A Peer Review Sheet is included.
Curated OER
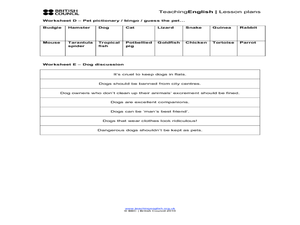
Pet Mania
In this English worksheet, learners focus on pets. Students survey their classmates, role play, read short articles, and have a discussion centered around the topic of pets.
Polk Bros Foundation
Meet the Nonfiction Main Idea Challenge
Help your class develop the ability to determine a main idea with a packet of materials that you can introduce and use over a period of time. The packet includes some information for the teacher and rationale for the exercises. There are...
Illustrative Mathematics
Baseball Cards
Here is a resource that demonstrates growth and the initial state of an equation. In this case, your class will be looking at baseball collections. How many baseball cards did the collector start out with, and how many were added or...
Michigan State University
Wanted Dead or Alive
Wanted! Pests are on the loose! Here, class members create a wanted poster highlighting one pest. Posters includes a picture, description, and signs of pest activity.
Virginia Department of Education
Factoring for Zeros
Relate factors to zeros and x-intercepts. Scholars first graph quadratics in both standard and factored forms to see that they are the same. They go on to use the graphs to see the relationship between factors and x-intercepts.
Miama-Dade County Public Schools
Patriot Day September 11, 2011
While many of our learners may recognize the date of September 11, 2001 in the United States, most will not be able to personally recall what transpired. On Patriot Day, introduce your young learners to the events, aftermath, and...
Math Wire
Gingerbread Man Combinations
Gingerbread men are just like us—they're unique! Discover how many combinations are possible when constructing a gingerbread man with several choices for shapes and colors of eyes, noses, and buttons.
Balanced Assessment
Birthday Card
Add a twist to the practice of simplifying expressions. The task asks scholars to decode a mathematical puzzle using their knowledge of expressions. If they are able to write and simplify the expression, the mathematics behind the puzzle...
Balanced Assessment
Gligs and Crocs
Explore relationships between perimeter and area. Learners compare the measurement units of gligs and crocs. They use a given perimeter and area as well as specific measurement relationships to determine the scale of gligs to crocs.
Balanced Assessment
Bicycle Chain II
Apply geometric concepts to a design problem. Individuals examine the structural setup of the chain on a bicycle and use the measurements of the circles to determine the length of the chain.
Concord Consortium
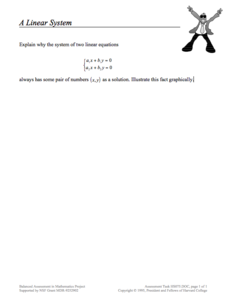
A Linear System
Young mathematicians have the hang of graphing with integer coefficients now. Can they generalize what they've learned to equations with variable coefficients? The task asks individuals to verify the solution to the system is (x,y) and...
Concord Consortium
Bicycle Chain
Model a bicycle chain with circles and tangent lines. Given the dimensions of the sprocket wheels, young scholars calculate the length of the chain that surrounds them. A second task has learners write a function for the length of a...
Concord Consortium
Gestation and Longevity
Is the gestation length of an animal a predictor of the average life expectancy of that animal? Learners analyze similar data for more than 50 different animals. They choose a data display and draw conclusions from their graphs.


