Curated OER
Hurricanes
Eighth graders gather information on hurricanes that are affecting the world at the time of the lesson. They work together in groups to collect the data and record their information in a table. They are asked questions to finish the lesson.
Curated OER
Calendar & Weather Book
Second graders track weather patterns through the school year. They take daily readings and record them in a weather book.
Curated OER
Comparing Temperature, Pressure, and Humidity
Students investigate data on temperature, pressure, and humidity by downloading information from the ARM Website. Working in groups, they discover how weather impacts life in each of the ARM sites. They record weather data in their...
Curated OER
Comparing Forecasts To Today's Weather
First graders compare forecasts to today's weather. They gather information about today's weather and record it on a chart. Students record information on the weather and discuss the importance of forecasts.
Curated OER
Probability
Sixth graders explore the concept of probability. In this probability lesson, 6th graders collaborate to collect spinner data based on the likelihood of spinning odd and even numbers. Students complete 2 other probability activities and...
Curated OER
Historical Temperatures
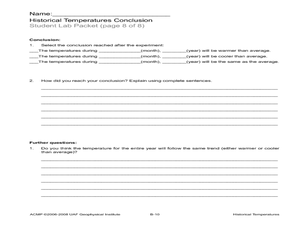
Students research historical regional temperatures for their current season. In this historical weather instructional activity, students conduct weather station and Internet research to learn about historical regional temperatures....
Curated OER
Does Cloud Type Affect Rainfall?
Student uses MY NASA DATA to obtain precipitation and cloud type data. They create graphs of data within MY NASA DATA. They compare different cloud types as well as precipitation types. They describe graphs of the precipitation and cloud...
Curated OER
Cloudy with a Chance of........
Fourth graders watch a video about Utah's weather and illustrate the water cycle. They read "Cloudy with a Chance of Meatballs" and identify weather words after listening to the weather radio. They create weather measurement instruments...
NASA
Down to Earth
There are only 10 types of people in the world: those who understand binary and those who don't. The lesson includes four activities in which students learn binary, convert binary to images, understand CCD arrays, and interpret...
Curated OER
Weather Conditions During the Spring Monarch Migration
Middle schoolers keep detailed weather records during the spring migration of the monarch butterfly. To keep track of the weather, students utilyze weather reports and instuments such as anemometers, compasses, thermometers and rain gauges.
Curated OER
Weather Conditions During the Spring Monarch Migration
High schoolers keep a detailed record of weather patterns during the spring migration of the monarch butterfly. The use of weather reports is used to form a class data sheet. This lesson connects to the skills of graphing and critical...
Curated OER
Weather Or Not
Young scholars use the internet to find pen pals to share in their weather experiment. Individually, they research the high and low temperatures for cities within the United States and email the results to their pen pal. They also...
Curated OER
Surface Meteorological Observation System (SMOS)
Students monitor local surface weather conditions for at least 30 days. They interpret the data by graphing it and detemining percentages.
Curated OER
Circle the Earth - Explore Surface Types on a Journey around Earth
Students use CERES percent coverage surface data with a world map in locating landmasses and bodies of water at Earth's Equator.
Curated OER
Basic Excel
Students explore basic Excel spreadsheets. In this spreadsheet lesson plan, students enter Alaska weather information and perform calculations. Students title the columns on the spreadsheet and format the cells. Students complete...
National Wildlife Federation
Citizen Science to the Rescue!
You don't have to be a scientist or even out of high school to contribute to scientific research. In the 12th lesson in the series of 21, scholars use this opportunity to add to the growing body of scientific knowledge and consider the...
Curated OER
Highs and Lows
Learners use email to chart weather patterns and then graph their findings. In this weather patterns lesson, students chart their weather for a week at the school. Learners then use email to find temperatures at a variety of locations....
Curated OER
Predicting Monthly Precipitation
Students should log onto, and collect data from, a specific site on the Internet. They average and compare the data using the Excel spreadsheet program, make predictions from their data, and determine the percent error of their predictions.
Curated OER
Weather Words
Third graders gather together as a class and share any facts or words about the science unit "Weather Elements". They listen to the story/poem, "Listen to the Rain" and recall any weather related words from the story.
Curated OER
How's the Weather
Students explore weather patterns. They collect and record all aspects of the weather from various sites. Students investigate regional weather and use a spreadsheet to record and chart data. Students chart temperature, humidity,...
Curated OER
Range, Mean, Median, and Mode
Eighth graders find the range, median, mean, and mode of a data set. In this finding the range, median, mean, and mode of a data set lesson, 8th graders collect data about the high and low temperature for 10 different cities. Students...
Curated OER
Bar Graphs
Young scholars perform operations and graph their data using charts and bar graphs. In this algebra lesson, students follow specific steps to make a bar graph. They create a survey about people favorite things and plot their data from...
Curated OER
Flight of Angles of Inclination
Students measure the flight of a gilder. In this fight of angles lesson, students explore the flight of a glider and measure the distance flown. They collect statistical data of the flights and determine the slope of each flight. ...
Curated OER
Temperature High and Lows
Learners gather high and low temperature readings through email. For this temperature graphing lesson, students use a spreadsheet to input data for a graph. learners interpret the graphs to compare and contrast the data from different...


