Curated OER
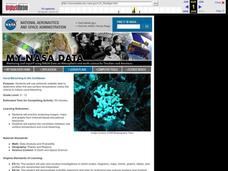
Coral Bleaching in the Caribbean
Students use authentic satellite data on the NASA website to determine when the sea surface temperature meets the criteria to induce coral bleaching.
Curated OER
Chemical Weathering
Students measure the effect of water temperature on the rate of a chemical reaction, similar to the interaction of a weak acid and carbonate rock, using hot water and effervescent antacid tablets.
Curated OER
Worm Weather Predicted
Students examine worm habitats. In this animal habitats lesson, students participate in a lab activity that requires them to explore the adaptations that earthworms make to their environment.
Curated OER
Make Your Own "Weather" Map
Students develop and apply a variety of strategies to solve problems, with an emphasis on multi-step and non-routine problems. They acquire confidence in using mathematics meaningfully.
Curated OER
Sunrise/Sunset
Pupils apply data from a weather-related website to predict patterns in the sunrise and sunset.
Curated OER
Teaching about Diel Temperature Variation
Learners explore temperature variation in lakes and deal with the data.
Curated OER
CSI Clamshell Investigation
Students explore predator/prey relationships. They research information on moon snails and claims. Students draw conclusions from the data collected. They use math and graphing to determine if there is a relationship to the clam's size...
Curated OER
Will There Be Ozone Tomorrow
Students collect and analyze real time data. They make comparisons and determinations about the status of ozone in their local area and predict the Ozone level for the next day
Curated OER
Temperature Comparisons
Students practice plotting temperature data points on a line graph in groups and examine the temperature differences at the same time of year. They graph the temperatures in Lannon, WI, and Mitchell's Plain, SA. After the data has been...
Curated OER
Probability: the Study of Chance
Students experiment to determine if a game is fair, collect data, interpret data, display data, and state and apply the rule for probability. Students use a simple game for this experiment.
Curated OER
What is a Cloud
Third graders study clouds and how they are formed. They write acrostic poems about clouds and analyze and graph temperature data collected during varying degrees of cloud cover.
Curated OER
Physical Characteristics of the Troposphere
Students lexplore environmental trends in the troposphere- temperature, dew point, pressure and wind speed- by checking their hypotheses against data collected by weather balloons.
Curated OER
Physical Characteristics of the Troposphere
Students examine troposphere graphs and mcompare their hypotheses with data collected by weather balloons launched from the NOAA ship, Ronald H. Brown. they write summaries about the physical properties of the troposphere.
Curated OER
CO Buildup City
Students conduct a controlled experiment. They collect data in an organized manner. Students analyze data to reach a conclusion and communicate findings. They explain how city size, temperature, and pollution is related to the air quality.
Curated OER
Power In The Wind
Students experiment designing graphs of selected readings from the Nebraska sites from the Power in the Wind study. They choose whether or not to put their data in a spreadsheet program to make a computer-generated graph or to complete...
Curated OER
Calculating Profits from Selling Virtual Lemonade
Students set up and collect data for a virtual lemonade stand. In this entrepreneurship, economics, and technology lesson, students purchase ingredients, determine costs, and set up a virtual lemonade stand. Students consider weather...
Curated OER
Microclimates of Our School
Students read the story "Weslandia" by Paul Fleischman, define the term microclimate, gather and record data in various places on school grounds to establish the presence of difference microclimates, analyze and compare microclimates,...
Curated OER
Paint Property Experiments
Students identify various kinds of paints by using the scientific method. In this solvents lesson students collect data and identify paint samples while working in teams.
Curated OER
What's Under My Feet?
Students choose one rock from a collection of igneous, metamorphic, and sedimentary rocks. They use multiple resources to create an informational brochure highlighting their rock. The brochures are combined into a class rock museum to be...
Curated OER
The Monarch Watch
Students collect and examine the life cycle of monarch butterflies. They also tag butterflies and release them as part of a nation-wide project to study monarch butterfly migration.
Curated OER
Chasing El Niño
Students view a video clip about the effects of El Nino. They work together to develop a question about weather folklore. They participate in an experiment that tests their hypothesis.
Curated OER
Rain On
Fourth graders study the water cycle and clouds. In this water cycle and cloud lesson, 4th graders determine the definition of condensation and watch a demonstration in which the teacher makes a cloud in a bottle. They discuss the water...
Curated OER
My Community
First graders design a Powerpoint presentation to reflect information about their community. In this community lesson, 1st graders create slides to explain the weather, geography and other information about the city.
Curated OER
Internet Project - Project Groundhog
Young scholars share weather and community information with other students across the continents. In groups, young scholars collect details, pictures, and drawings about their community, its weather patterns, and school. They predict if...


