Curated OER
From Ada to Grace to Sandy - Women Have IT
Explore the significant contributions women have made in the field of information technology with an instructive lesson plan. Through class discussion and research, learners discover how women have aided in the growth of the field of...
Curated OER
Predicting Monthly Precipitation
Students should log onto, and collect data from, a specific site on the Internet. They average and compare the data using the Excel spreadsheet program, make predictions from their data, and determine the percent error of their predictions.
Teach Engineering
Using Hooke's Law to Understand Materials
Provide a Hooke for a lesson on elasticity with an activity that has groups investigate a set of springs. They use a set procedure to collect data to calculate the spring constant for each spring using Hooke's Law. The groups predict the...
Curated OER
Ghost Crystals - Light & Water
Woo, ghost crystals, just in time for Halloween! Young scientists experiment with light and water as they make and observe ghost crystals. The lesson does not include the process for making the crystals, but provides a web link where a...
Curated OER
Solar Surfing
Students explore sources of solar astronomy. They use the internet to identify web pages associated with solar observatories, astronomical organizations, and educational sights associated with both. Students identify the type of...
PBS
Stories of Painkiller Addiction: The Cycle of Addiction
Drug addiction, including prescription drug addiction, begins with a reason that's different for every user. High schoolers learn more about the reasons people begin abusing drugs with a set of videos and worksheets that discuss four...
Curated OER
Global Water Cycle & Heat Flow
Students experiment to discover how different variables affect the water cycle. They do hat flow experiments and construct a computer heat flow model.
Curated OER
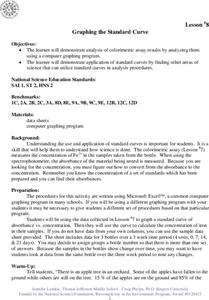
Graphing the Standard Curve
Srudents demonstrate analysis of colorimetric assay results by analyzing them using a computer graphing program and demonstrate application of standard curves by finding other areas of science that can utilize standard curves in analysis...
Curated OER
Graphing and Analysis of Water Quality Reports
Students practice making graphs and interpreting them. They compare and contrast different sets of data. They use Microsoft Excel to create different types of graphs.
Curated OER
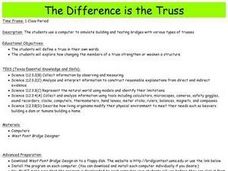
The Difference is the Truss
Students use a computer to simulate building and testing bridges with various types of trusses.
Curated OER
Temperature Graphing
Students analyze temperature variations throughout the world by using computer graphing of select major national and international cities. After analyzing their findings, students write a paragraph explaining their data.
Curated OER
Geographic Effects on Precipitation, Water Vapor and Temperature
Students investigate the factors affecting climate using Live Access Server. In this geography lesson, students graph atmospheric data using Excel spreadsheet. They compare and contrast temperature, precipitation and water vapor of two...
Curated OER
Names in the Field: A Simple GPS Field Exercise
Students explore basic methods of GPS data collection, uploading the data to a computer, and making simple maps of their data using GIS software. They create a map of the data using GIS software (or Excel)
Curated OER
The Effect of Medications on Daphnia
High schoolers explore how human beings affect the world's ecosystem by examining the affects of medication on daphnia, a small freshwater organism very sensitive to pollution. Students use a computer model to repeat the experiment and...
Curated OER
Electronic Hydrology Lesson Plan - Revised
Pupils use Excel spreadsheets. They predict time and height of peak flow on river
Curated OER
"Arsenic and Old Waste": Groundwater Activities Using Modeling
Students develop models of groundwater and pollution flow. They research information using the Internet and develop models of groundwater flow in Stella and Excel.
Curated OER
Plants Under Attack
Third graders will identify the four needs for plant survival and gain skills and confidence in using scientific measurement tools, probes as well as the spreadsheets and graphing capacity of a computer to represent and analyze data.They...
Curated OER
A Holiday Card in KidPix
Students create a holiday card using computer software. In this computer card making lesson, students design an original holiday card using a variety of tools. Students navigate the software utilizing various tools.
Curated OER
The Big Hand Challenge
Students utilize a computer spreadsheet to record and analyze data. In this problem solving lesson, students compare their hand size to that of the principal. Students understand standard and nonstandard measurement.
Curated OER
Ancient Peoples of the Middle East
This is an excellent multidisciplinary lesson designed by Scientific American. It provides three creative activities--designing a garden, studying hieroglyphics, and writing poetry--relevant to the ancient peoples of the Middle East....
Curated OER
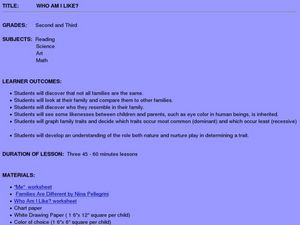
Who Am I Like?
Young scholars examine family structures. In this family structure activity, students discover things about their own families and those of their classmates. They make a chart as they discuss nature versus nurture, complete a worksheet...
Curated OER
The Impact
Students study inventions and how they have impacted us. In this investigative lesson students study the history of two inventors then pretend that they are an inventor.
Curated OER
Watery World
Students brainstorm to develop resource/reference charts for later use. they are introduced to Microsoft Word and to an internet movie site. They use prepared chart headings, to respond to questions posed on each chart such as: Where do...
Curated OER
Global Warming Statistics
Learners research and collect data regarding temperature changes for a specific location and find the mean, median, and mode for their data. In this climate change lesson plan, students choose a location to research and collect data...


