West Contra Costa Unified School District
Key Features of Graphs
The key is ... After a day of instruction on key features of graphs, groups create a poster and presentation on the key features of their given function graph. The resource provides an extension activity of "telephone" using graphs.
American Statistical Association
Don't Spill the Beans!
Become a bean counter. Pupils use a fun activity to design and execute an experiment to determine whether they can grab more beans with their dominant hand or non-dominant hand. They use the class data to create scatter plots and then...
National Research Center for Career and Technical Education
Break-Even Point
How do companies determine the prices of their products? Marketing maestros discover the concepts of cost and break-even point through discussion, independent practice, and a collaborative assessment. The career and technology-oriented...
Curated OER
Long Distance Phone Plans
In this long distance phone plane worksheet, young scholars compare various phone plans and determine which long distance plan has the greatest savings. Students support their answers visually through the use of tables and graphs. They...
Curated OER
Creating a How To Book
Third graders investigate "How To" books by watching a "How To" video and looking at books in the media center. They make a class "How To" book with a title page, table of contents, individual student pages, and graphics which they make...
Curated OER
Making A Table
Sixth graders explore creating tables as a way to organize data. Students read story problems and discuss methods and strategies to solve them. They practice drawing tables, spotting patterns, and identifying missing information.
Curated OER
Properties of Elements
Eighth graders explore information about the periodic table of elements. Using the Internet, 8th graders choose one element to research. They complete an "Adopt and Element" information sheet. Using Microsoft Word, students create an...
Curated OER
Handling Data
Students create a simple table in order to solve a problem. As a class, they create a simple data table in order to discover the number of letters in each student's name. This data is interpreted in order to answer questions and make...
Curated OER
Get On Board
Students create a ticket table illustrating the cost of tickets by alternative transportation. In this number sense lesson, students write number sentences to compare and contrast difference information in their chart. Students figure...
Curated OER
Skittles, Taste the Rainbow
Fifth graders learn and then demonstrate their knowledge of a bar and a circle graph using the classroom data. Students are given a pack of skittles candy. Students create a bar and circle graph indicating the results of the contents of...
Curated OER
What Can I Afford?
Students explore the concept of cell phone plans. In this cell phone plan instructional activity, students research the cost of cell phones. Students compare various cell phone plans and decide on which phone plan is best for them.
Curated OER
Identify and Graph Linear Equations
Learners investigate linear functions. In this mathematics lesson, students plot points onto a graph by solving the equations y=x and y=mx+b by being given numbers for x and solving for y.
Curated OER
Creating a Basal Area Measuring Tape
Young scholars use formulas to design and create a table. In this calculations lesson students create basal measuring tapes that will be used to measure woodlot stocking levels.
Curated OER
The Periodic Table of the Elements
Students examine different elements and explore how their properties play a role in technology. In this periodic table lesson students view a few short videos, answer questions then research the Internet to find products made from...
Curated OER
Function Tables
Young scholars practice representing problems found in the real world in terms that can be translated into mathematical expressions. The situations are represented in tables and graphs by students.
Curated OER
Biocomplexity Lab Activity: Creating Salt Water
The lesson seeks to intorduce to students the properties of salt water and how to create salt water. Teacher gives backgound information about salt water to students. From that point, students dscuss what elements are in salt water....
Curated OER
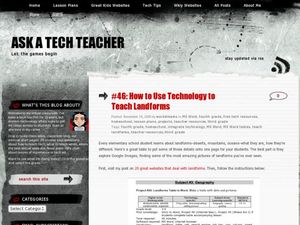
How to Use Technology to Teach Landforms
Students create a landform table on the computer. In this geography lesson, students use Microsoft Word to design a 3 column table. They list different landforms, examples, and attach a picture of each.
Curated OER
Patterns Here, There, and Everywhere!
Upper graders access the Microsoft Word program and create patterns by utilizing certain keys on the keyboard. They create picket fences, smiley faces, and hearts. It seems that this lesson has as much to do with keyboarding skills as it...
Discovery Education
Sonar & Echolocation
A well-designed, comprehensive, and attractive slide show supports direct instruction on how sonar and echolocation work. Contained within the slides are links to interactive websites and instructions for using apps on a mobile device to...
Curated OER
NteQ Lesson Plan for S.E. Hinton's The Outsiders
Explore literature through the completion of reading comprehension worksheets in class. After reading the classic book, The Outsiders by S.E. Hinton, middle schoolers review each chapter by completing study questions and story webs....
Curated OER
Grow an Alum Crystal
What an exciting lab experiment to conduct with your high school chemistry class! Crystals are formed naturally in the environment. However, allow your blossoming chemists to create their own unique crystals using alum and water. You may...
Chymist
Plop, Plop, Fizz, Fizz
One of the most recognizable commercial melodies was written in 1977, and led to gastronomical relief around the world. Scholars use Alka Seltzer tablets to measure reactants and calculate the chemical equation for the reaction of NaHCO3...
Curated OER
Using Averages to Create Graphs Through Excel
Sixth graders create and use a spreadsheet to make graphs which will be used to analyze Progress Report and Final Report Card grades. They practice finding the mean, median, mode, and range of a data set. Students also incorporate column...
Curated OER
Creating a Nutrition Table in MicroSoftExcel
Middle schoolers access the internet to find Nutritional information from a restaurant of their choice and compile their information into an excel spreadsheet.


