Curated OER
Fossils
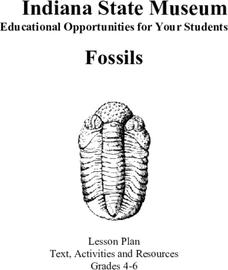
Students complete a unit on fossils. They read and discuss informational handouts, define key vocabulary terms, answer discussion questions, create a geologic timeline and a timeline of their own life, analyze bones, and create a fossil...
Curated OER
Oobleck, Goop, and Glurch
Sixth graders use teacher prepared samples of substances. They perform the same observations and complete charts for each substance. After recording and analyzing their results, 6th graders make changes in the recipes to create a better...
Curated OER
Pythagorean Theorem
Students discover the Pythagorean Theorem. In this discovering the Pythagorean Theorem lesson, students measure the lengths of various triangles to the nearest centimeter. Students record their measurements in a table. Students square...
Curated OER
Building A Nation
Students build their own nation in groups where they create a name, flag, declaration of independence, form of government, mathematical layout, and more. In this nation lesson plan, students also provide a scale drawing of their nation...
Curated OER
What Influences Reaction Rate?
Learners study reaction rates, what determines how fast a reaction happens and how the chemical changes occur. In this reactions lesson students complete a lab where they use Alka-Seltzer to observe reaction rate and create a graph with...
Curated OER
Holocaust Theme
Learners complete a unit of lessons on the events of the Holocaust during WWII. They write daily journal entries, create a collage, view and discuss videos, read and analyze novels and poetry, and complete a novel project.
Curated OER
Canada's Natural Regions and Their Varied Characteristics
Students examine Canada's six natural regions, with all their underlying human and economic activities, identify specific characteristics of each region, discover economic and human riches of natural regions and, create presentations to...
Curated OER
My Family Tree
Students create a family tree. In this ancestry lesson plan, students research a country that one of their ancestors is from. Students interview a grandparent and map out a family tree.
Curated OER
Who Takes Care of the Maya Forest Corridor?
First graders study the animals in the Maya Forest Reserve. In this conservation lesson plan, 1st graders create a graph to compare the environment of animals to their own. They design a 3D model of these two environments.
Curated OER
Our Favorite Season Lesson Plan
Fifth graders complete a survey about their favorite season of the year. Using Excel, they create a graph using the chart wizard and copy it into Microsoft Word. They explore the relationship between the survey and the bar graph.
Curated OER
Inventors Unit Survey
Students develop and conduct a survey for their inventors unit. They create a five question survey and tally the survey results, and create a graph using Microsoft Word and Graph Club 2.0.
Cornell University
What Happens When We Excite Atoms and Molecules?
Excited atoms lead to exciting lessons! Learners use heat and light to excite both atoms and molecules. They display their learning in the form of Bohr models depicting the excited state of the atoms.
Virginia Department of Education
Chemical Bonds
How are chemical bonds similar and how are they different? Provide your young chemists with the resources to more thoroughly understand the concepts of ionic and covalent bonds. Pupils research these topics, diagram examples of each...
US Navy
The Science of Diving
Introduce gas laws using the popular topic of SCUBA diving. This activity makes a connection between the gas laws and the effect of pressure and temperature changes during diving. Young engineers complete introductory experiments to...
Virginia Department of Education
States and Forms of Energy
Energy is just energy, right? Explain various forms of energy to your young scientists by using an interactive experiment that contains common objects to demonstrate complex concepts. Pupils conduct experiments for radiant, thermal,...
University of Georgia
Using Freezing-Point Depression to Find Molecular Weight
Explore the mathematical relationship between a solvent and solute. Learners use technology to measure the cooling patterns of a solvent with varying concentrations of solute. Through an analysis of the data, pupils realize that the rate...
Curated OER
Martin Luther King and Malcom X on Violence and Integration
Dr. Martin Luther King and Malcolm X were contemporaries. Both were gifted orators, both were preachers, both were leaders during the Civil Rights era, both were assassinated. But the two had very different views on violence and...
Curated OER
Stock Market Game
Fourth graders are introduced to how the stock market operates. In groups, they practice reading and analyzing the Standard and Poor's 500 index. They participate in a simulation of buying and selling stocks on the market trying to...
Curated OER
Golden Ratio
Tenth graders investigate the Golden Ratio. For this geometry lesson, 10th graders explore the Fibonacci sequence in the context of The Fibonacci Rabbit problem. Students examine how the ratio of two consecutive Fibonacci number create...
Curated OER
Following a Recipe
Students create a cookbook. In this recipe and writing lesson, students brainstorm the skills necessary to follow a recipe, watch a cooking show and write down a recipe used. Students use a word processing program to write a paragraph...
Curated OER
Data! Data! Graph that Data!
Fifth graders create data graphs using Microsoft Excel. In this data collection instructional activity, 5th graders create and conduct a survey, then use Excel to organize and graph their data.
Curated OER
Pumped Up Gas Prices
Learners calculate gas prices. In this transportation lesson, students tally the mileage and gas costs of their car for one months. They figure out how much was spent on gas and create a graph showing average gas prices over time.
Curated OER
Histograms and Statistical Graphics
In this statistics worksheet, students solve 6 data problems. They construct a histogram of given data, they create a frequency polygon, and a stem and leaf diagram. Students create a dot plot and a pie chart for given data sets. On the...
Curated OER
Using a Spreadsheet
Young scholars create a spreadsheet to analyze data. In this technology lesson, students develop and use an Excel spreadsheet to log their data. They solve real life word problems as they set it up using the spreadsheet.


