Curated OER
Introduction to Graphical Representation of Data Sets in Connection with Nuclear Decay
Students record data, make observations, and share in experimentation and discussion of numerical experiments.
Curated OER
Unit Perimeters and Areas
Students use Geometers SketchPad to find the area and perimeter of several shapes. In this geometry lesson, students determine area of rectangles and progress through irregular polygons. None of the referenced worksheets are included...
Curated OER
Weighing Time
Young scholars devise a strategy to solve problems that is done in a systematic and mathematical fashion. The finding of the unknown value is the focus of the lesson. To solve linear equations proficiently is the skill of the lesson.
Curated OER
The Dynamics of Populations
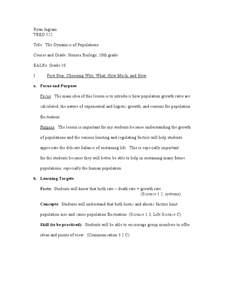
Tenth graders analyze the growth rate of different population. In this biology experiment, 10th graders identify the biotic and abiotic factors that limit population size. They create a poster to show their findings in class.
Khan Academy
Khan Academy: Algebra I: Exponential vs. Linear Growth Over Time
Practice analyzing the end behavior of two functions that model similar real-world relationships, where one function is exponential and the other is polynomial. Students receive immediate feedback and have the opportunity to try...
Khan Academy
Khan: Lsn 8: Interpreting Relationships in Scatterplots/graphs/tables/equations
This lesson focuses on Interpreting and analyzing linear, quadratic, and exponential models and graphs. Students will use best fit lines to interpret contexts, distinguish whether contexts are linear or exponential functions, use the...
Khan Academy
Khan Academy: Equations & Inequalities Word Problems
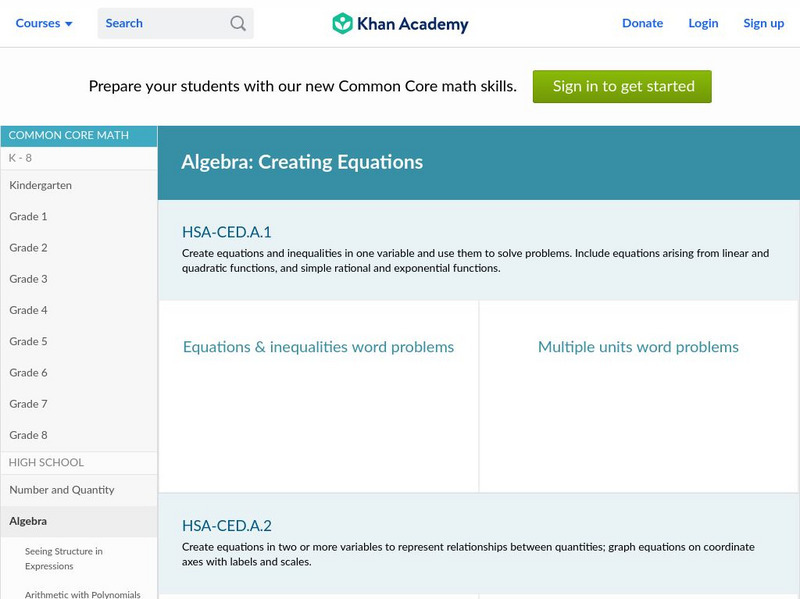
HSA-CED.A.1: Interactive resource which create equations and inequalities in one variable and use them to solve problems. Include equations arising from linear and quadratic functions, and simple rational and exponential functions....
Illustrative Mathematics
Illustrative Mathematics: F Le Us Population 1790 1860
In this task, students are shown a table of U.S. population data between 1790 and 1860 and are asked to explore whether exponential functions would be appropriate to model relationships within the data. The purpose of the task is to help...
National Institute of Standards and Technology (NIST)
Nist: Engineering Statistics Handbook: Scatter Plots and Linear Regression
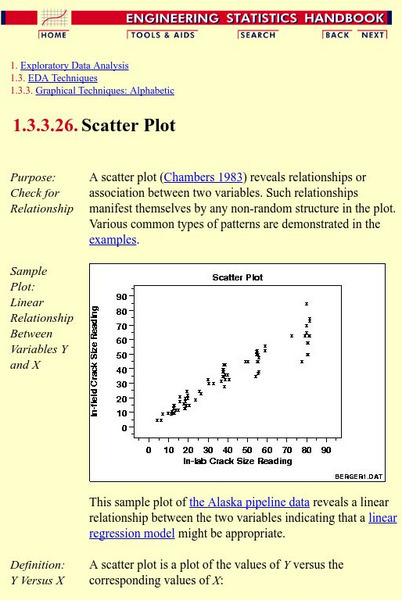
An explanation of scatter plots followed by examples of the many different kinds of scatter plots.
Illustrative Mathematics
Illustrative Mathematics: F if a Sse Modeling London's Population
In this task, students are shown a table of population data for the city of London and are asked to explore whether a linear, quadratic, or exponential function would be appropriate to model relationships within the data. They are next...


