Curated OER
Shedding Light on the Weather with Relative Humidity
Learners study weather using a graphing calculator in this lesson plan. They collect data for temperature and relative humidity for every hour over a day from the newspaper, then place the data in their handheld calculator and examine it...
EngageNY
From Ratio Tables, Equations and Double Number Line Diagrams to Plots on the Coordinate Plane
Represent ratios using a variety of methods. Classmates combine the representations of ratios previously learned with the coordinate plane. Using ratio tables, equations, double number lines, and ordered pairs to represent...
Curated OER
Applied Science - Science and Math Lab
Students investigate topology. In this Applied Science lesson students explore higher, more abstract mathematics using tangles. Students make topologically related shapes.
Flipped Math
Calculus AB/BC - Exploring Accumulation of Change
Add up area to find total change. Pupils learn what it means to find the area under a curve and how to calculate it geometrically. They first find the accumulation of change given a rate of change function. Scholars then apply that...
GeoGebra
Too Big, or Not Too Big
Determine whether the point is just right. The interactive allows participants to input a constraint equation. Pupils pick a point and determine whether it is too big, not too big, or just right for the constraint. Using the graphing...
Curated OER
Introduction to Linear Functions
Students are introduced to the concept of linear functions. Using new terminology, they describe linear functions in sentences and in data tables. Using the internet, they calculate and record answers to problems which are discussed...
Curated OER
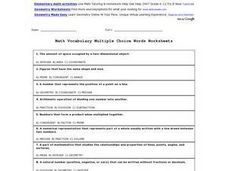
Math Vocabulary Multiple Choice Words Worksheet
In this math vocabulary worksheet, students complete multiple choice problems where they match the correct math vocabulary word to its definition. Students complete 15 questions.
Curated OER
Algebra 1
Students study the functional relationships of a variety of problems. In this functional relationship lesson, students determine the dependent and independent quantities of a given set of data. Students record the data and write it in...
Illustrative Mathematics
Downhill
A car traveling down a steep hill is the model for this resource. The confusion comes when the elevation, E, is given in terms of distance, d. The distance, d, is the horizontal distance from E. Therefore, the equation, E = 7500 – 250d,...
Curated OER
Task: Range of Motion
If you have ever injured your shoulder, you know it takes a while to improve your arm's range of motion. In this real-world example, young mathematicians gain insight into the world of physical therapy while they analyze a case study...
NTTI
Putting Together Ten
Groups explore sets of 10 items in two varieties (i.e. 3 white buttons and 7 black ones, or 5 bears and 5 bunnies). They brainstorm about their objects, write math sentences to represent what they have, and report their discoveries to...
Virginia Department of Education
Matching Representations
Pupils explore the many representations of linear functions by completing a matching activity to connect the multiple representations of a function. They then reinforce the connection as individuals create the different representations...
Virginia Department of Education
Radical Equations
Provide students with the skill for how to examine algebraic and graphical approaches to solving radical equations. Learners solve various radical equations involving square root and cube root expressions. They first solve using...
Curated OER
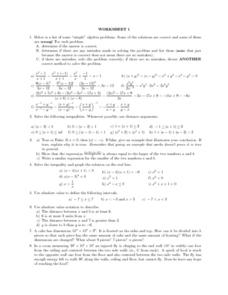
Worksheet 1: Algebra and Inequalities
Challenge your students' algebra skills with this activity, which presents students with several types of problem sets, including solving inequalities, graphing, word problems, and a set of algebra problems that may or may not require...
Curated OER
Using Computer for Statistical Analysis
Students use the computer and S'COOL data for statistical analysis.
Curated OER
The Bell Curve
Learners are introduced to the concepts of the normal curve, skewness and the standard deviation. They discuss how the normal distribution has been used and misused to support conclusions.
Curated OER
When the Snow is as High as an Elephant
High schoolers study the concept of mean values using a data plot. Learners enter the given data in the activity to create their data table. They use the data table to calculate the mean of the snowfall percentage provided in the...
Curated OER
Challenge Discussion Sheet 4
in this derivative instructional activity, students find the derivative for the function w'(t) and tell the meaning of this. They create a sign chart for the derivative of two functions. Students create the graph of the derivative of a...
Curated OER
Midterm 1 Exam: Statistics
In this statistics worksheet, students determine the mean, variance, standard deviation and median of given statistical data. They organize data, create box-and-whisker plots and identify outliers. This nine-page worksheet contains 7...
Inside Mathematics
Conference Tables
Pupils analyze a pattern of conference tables to determine the number of tables needed and the number of people that can be seated for a given size. Individuals develop general formulas for the two growing number patterns and use them to...
Illustrative Mathematics
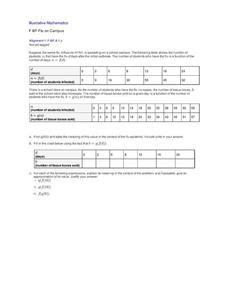
Flu on Campus
An outbreak of the swine flu on a school campus has caused an increase in the number of boxes of tissues sold by the school store. In a real-world-modeling activity, pupils use composition of functions to determine how the number of...
Inside Mathematics
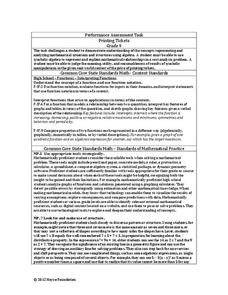
Printing Tickets
Determine the better deal. Pupils write the equation for the cost of printing tickets from different printers. They compare the costs graphically and algebraicaly to determine which printer has the best deal based upon the quantity of...
Inside Mathematics
Quadratic (2006)
Most problems can be solved using more than one method. A worksheet includes just nine questions but many more ways to solve each. Scholars must graph, solve, and justify quadratic problems.
Curated OER
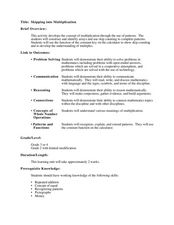
Skipping Into Multiplication
Young mathematicians study the relationship between skip counting and multiplication. They build on skip counting skills and examine arrays while studying multiplication. Resources are provided.


